Winerack Visualization
Winerack Visualizations display the 3D distances between the midpoints of the user-defined section of selected horizontal wells and their position within the formations defined by selected grids. You also have the option to visualize the Winerack View without the geographic reference of grids. Instead the view will use depths. The results are displayed in the following visualizations:
|
Deviation Surveys |
Shows a map view of the deviation surveys. Digitize a rectangle on the map to mark the wells to include in the visualizations. |
|
Projected X vs Y |
Shows the lateral distance between the defined midpoints of the selected wells. The size of the midpoint circle reflects the current production for the borehole. |
|
Winerack View |
Shows the placement of the borehole midpoints within the defined formations. Again, the size of the midpoint circle reflects the current production volume for the borehole. |
To create the winerack visualizations:
-
In the deviation survey table, select (mark) the wells to include in the analysis.
-
Right-click anywhere in the table and select Analytics Explorer > Winerack Visualization
-
In the Winerack Data Builder dialog box, specify the data tables and input parameters for Deviation Survey Geometry and Grids. See the sections below for details.
Deviation Survey Geometry
Deviation survey geometry includes 2 parameters: data in the deviation survey points table, and the heel location.
The deviation survey geometry requires 8 columns from the deviation survey points table:
|
|
An additional column, Is Active, is optional. The Is Active option is for boreholes that have more than one deviation survey table, and only one is the active table.
-
Select the Deviation Survey Table and click Column Mapping to ensure that the selected table has the required columns correctly identified in the selected table.
-
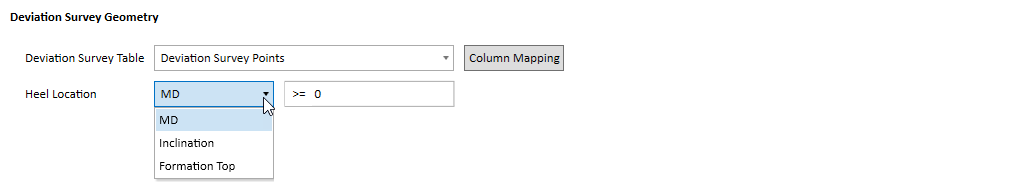
Now specify the Heel Location. You can specify the heel location by MD, Inclination, or formation top:
-
MD—enter a greater than measured depth as the borehole heel.
-
Inclination—enter a greater than inclination. For example, the inclination of a lateral well at the heel location will likely be greater than 85.
-
Formation Top—with Formation Top selected as the heel location option, select the formation top table. Then select the specific formation top that defines the borehole heel location.
-
Grid—with Grid selected as the heel location option, select the grid table. Then select the specific grid that intersects the borehole and defines the borehole heel location.
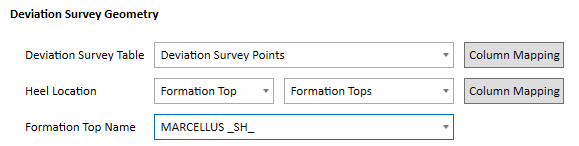
Note that you have column mapping options for both the Deviation Survey Table and Formation Tops table.
Grids
The selected grids define the formations for the winerack visualization and must be selected in stratigraphic order.
If you do not want to use grids, select Do not use grids. In this case, the subsea depths of the selected borehole midpoints will display with respect to the projected X without interpreted surfaces.
First select the grid table, the X, Y, and Depth columns, and the Grid Name. To add successive rows, click + under Actions.
There are 3 supported grid table formats:
|
A single grid table has a column for each named grid |
Select the single grid table, the X, Y, and Z columns, and then add rows to select successive grids (columns). |
|
Each grid has its own table |
Select the grid table and then the X, Y, and Z columns. Repeat for each grid table. |
|
A single table has all grids in the same column identified by name. Each grid has its own set of X Y Z values |
Select the grid table and the X, Y, and Z columns. Then check Multi. The Grid Name column will split into 2 columns - the first for the grid name column, and the second for the grid name. Remember there is one column for all of the grids, identified by grid name. |