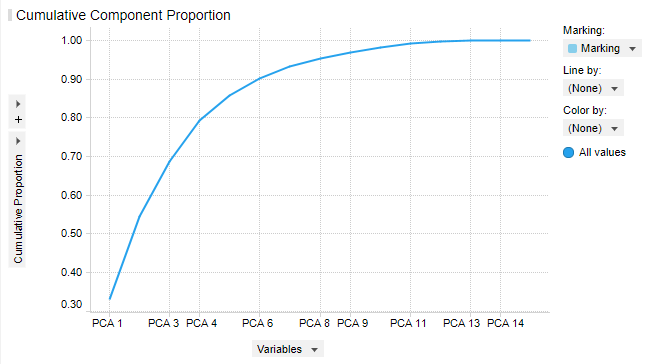
Cumulative Component Proportion Graph
The graph below plots a cumulative line of the percent the primary component variables have on the variation in the data.
- PCA1 alone explains almost 60% of the data variation
- PCA1 + PCA2 account for 70%
- PCA1 through 5 explain 90% of data variation.