Eigenvector Plot
Eigenvectors reflect the direction and proximity of the input variables included in the computation. The PCA computations identify and rank the eigenvectors that account for most of the data relationships (covariance).
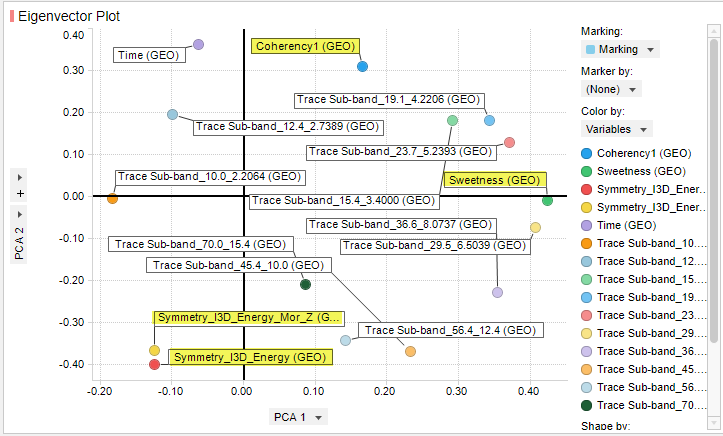
In the figure below the input variables are plotted in a 2D graph of PCA1 on the horizontal axis and PCA2 on the vertical axis. The variable with the highest PCA1 value is sweetness, a seismic attribute that highlights “sweet spots” that are frequently associated with sand shales as well as gas-saturated sands.
The variables with the highest PCA2 values are Symmetry_I3D_Energy in the negative direction and Coherency 1 in the positive direction. High I3D Energy values correspond to faults. High Coherency values are the opposite and correspond to unfaulted data. In the graph below, Coherency and I3D Energy values are both high, but in opposite quadrants signifying opposite attributes.