Example - FCA
Observations and commentary on the image below:
-
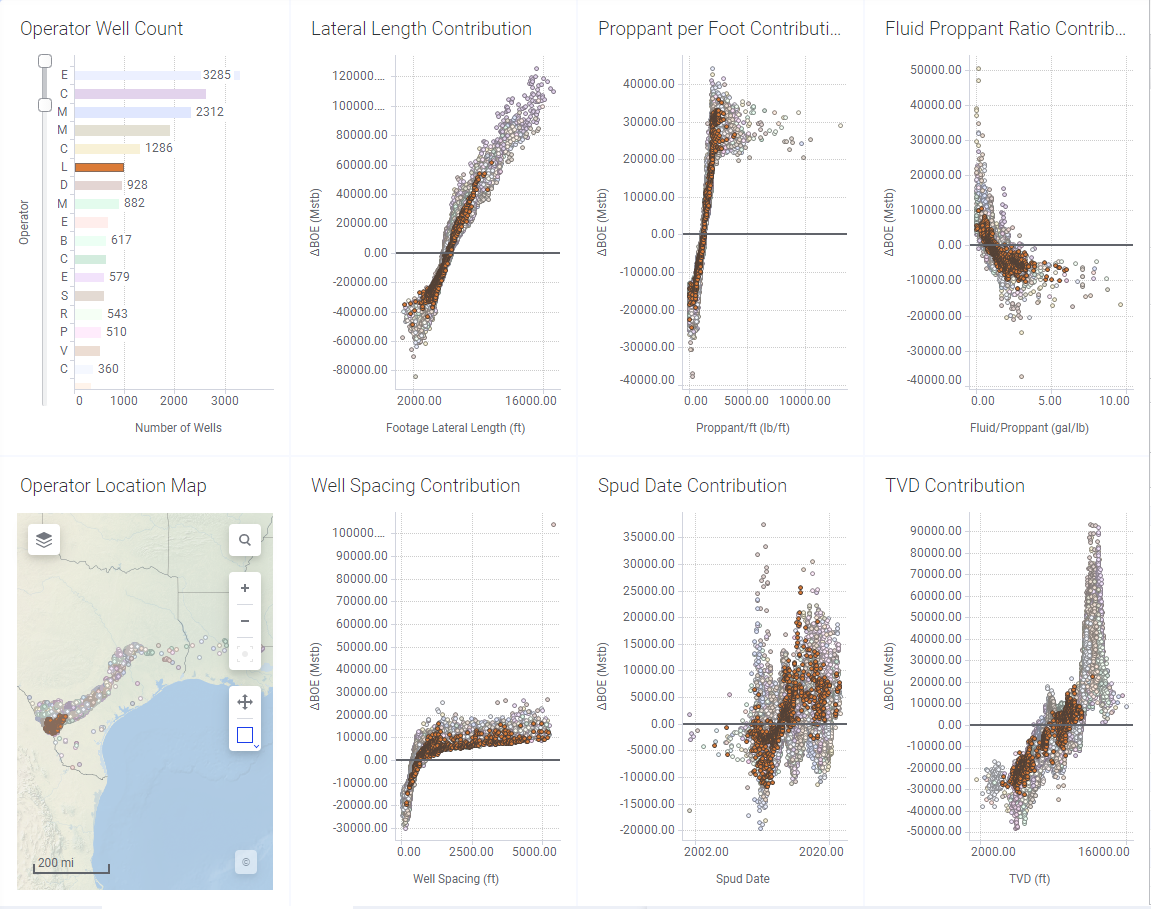
Operator Well Count—a single operator has been selected
-
Operator Location Map—wells for the selected operator are highlighted on the map
-
Lateral Length Contribution—BOE increases with increasing lateral length. This operator's wells reach a maximum lateral length of approximately 10,400 feet, with maximum BOE approximately 60,000 Mstb.
-
Proppant per Foot Contribution—this operator has optimized proppant/ft, with this factor clearly having a strong impact on performance. Proppant/ft topped at approximately 4000 lb.ft with a BOE of approx. 37,777 Mstb. Production reached its peak at 36000 Mstb at a lesser proppant/ft amount of 2461 lb/ft, possibly signifying a decreasing impact on performance.
-
Fluid Proppant Ratio Contribution—increasing fluid per lb of proppant has a negative impact on production. The highest performance for this operator was at a level of less than 0.5 gal/lb.
-
Well Spacing Contribution—the impact of well spacing on production seems to peak at 1000 feet. Production increases significantly up to a spacing of 1000 feet, and then levels off.
-
Spud Date—no clear general pattern on the contribution of spud date on performance, although the early spud dates for this operator clearly underperformed compared to later spud dates with peak performance in wells with a spud date of early 2016.
-
TVD Contribuition—this operator reached a maximum well TVD of 12,800 feet, with the majority of wells under 11.800 feet. In fact the TVD of many of its wells had a negative impact on performance.