Attribute Analysis
Attribute Analysis runs an error analysis on the selected input columns and determines which columns combined produce the least error, and ranks the importance of each variable in the calculation. After the process runs, the results are displayed in two charts: Mean Absolute Errors for Columns, and Importance per Variable. Typically the attribute analysis will narrow the input columns to a number under 10. You can then adjust the input columns to those the analysis determined were most important.
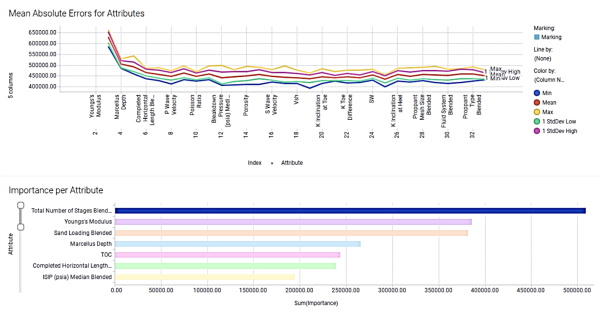
To run attribute analysis, the application takes the two input columns (variables) that are found to be most important, and adds one variable at a time. When the Mean Absolute Error line flattens out, it means that the error has basically reached its smallest value, so using additional variables in the calculation adds little to the accuracy of the calculation. The next step is to remove all input columns except the ones the application determined contributed to reducing the error for the final run.
In the figure below,the Mean Absolute Errors graph shows the MAE as each attribute is added. Note that the graph starts at 3 attributes, the minimum number. At 3 attributes, the MAE is high. In this example, close to 750000 out of the total estimated average production of approximately 7 million cubic feet, so around 10%. Adding the fourth attribute drops the MAE substantially, to around 500000. At around the 6th attribute, the line starts to flatten, signifying that adding additional attributes does not significantly affect the MAE.
The lowest MAE is at 19 attributes. Now based on the results we can build a new model using the identified top 19 attributes and the tuned hyperparameter values.
Once you determine which attributes are most important to the model, save the model as a template. All attributes and hyperparameter values are saved.
See Production Prediction Workflow for an example on how to analyze which attributes to use in a model.