Understanding the Vintage Analysis visualizations
The Vintage Analysis tab has 4 visualizations:
-
Vintage Distribution—a pie chart of the distribution of siblings, children, and parents
-
Data Distribution—a bar chart of the event date
-
Relationships—a custom diagram for the selected well(s) of interest showing its parent(s), sibling(s), and children
-
A scatter plot showing the XY coordinates of the deviation survey points for the selected wells of interest
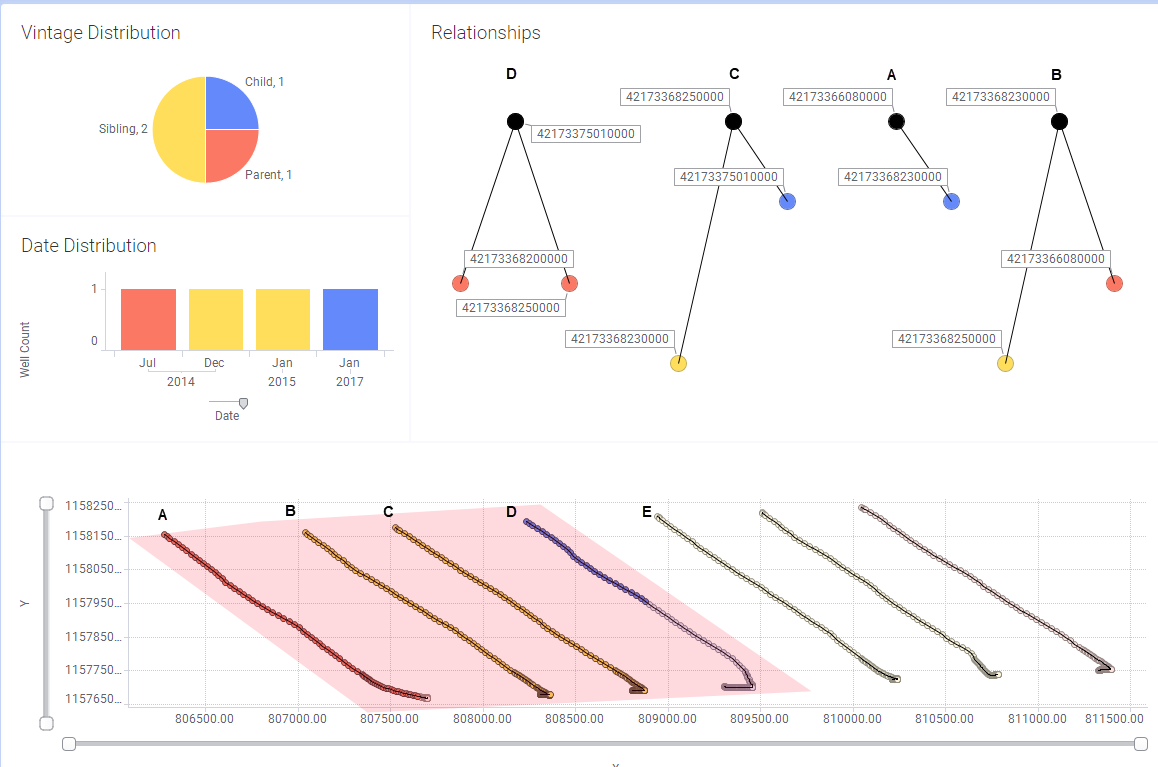
So let's examine the visualization above. The well subset that was analyzed contains 7 wells. These are plotted on the XY scatter plot at the bottom. For analysis, 4 wells were selected. Remember you can select them directly from the scatter plot. They are highlighted in the pink polygon and labeled A, B, C, D. These are additions to the image for clarification. The wells are not labeled in the actual visualizations. Well E was not selected for analysis, but is used to determine the well relationship tag of well D.
Looking at the Vintage Distribution, we see that of the 4 wells, 2 have been designated as siblings, one as a child, and one parent.
The Date Distribution shows the completion dates. The parent was completed in July 2014, which is outside of the 2 month time threshold of the next well completion in December 2014. The distance qualifies this well as a neighbor (within 1000 feet from the next well and thus a neighbor) but the completion date makes it a parent. The two siblings were completed within the 2 month threshold, with one in December 2014 and the other in January 2015. And finally the child, satisfies the distance criteria from the 5th well in the scatter plot, but the completion date of E was 6/25/2015, which is not within the 2 month threshold of the well of interest. Not that there is not a relationship diagram for well E as it was not selected for analysis. However, well D was selected and is therefore tagged with a well relationship.
Now let's look at the relationship diagrams. Each well of interest is defined by the top black circle. These have also been labeled to correspond to the wells in the scatter plot.
-
Well A has one child, and is therefore a parent.
-
Well B has a sibling and a parent. It is therefore tagged as a sibling. The sibling tag trumps the other tags.
-
Well C has a child and a sibling. Again, the sibling tag trumps the other tags and is therefore also a sibling.
-
Well D has 2 parents but no siblings. It is therefore a child.