Well Spacing Calculations
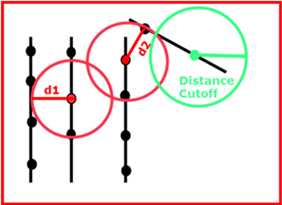
At every deviation survey point, Analytics Explorer computes the nearest distance in either 2D or 3D. Three examples are provided in the picture below regarding the recorded distance for a specific point. The green circle corresponds to the Distance Cut off (if not any nearest well is reached after the specified distance cut off, then the recorded distance for that point will be equal to the distance cut off defined by the user).
When targeting stack formations, this computation can also be done in 3D, accounting for Z value.
Please be aware that this computation is very extensive and can take from minutes to hours depending on the number of wells you are selecting.
The resulting Well Spacing visualizations open in the new Well Spacing tab and includes 4 graphs:
| Y vs X | The wellbore sticks plotted on a Y vs X crossplot. The wells selected for the well spacing computation are highlighted. |
|
Y vs X Subsea |
An 3D graph of the selected wellbores if the 3D option was selected. The section of the wellbore included in the calculation is highlighted. |
| Nearest Wellbore Information |
The data in table format showing the following measurements to the nearest wellbore, the identifiers of the nearest heel and toe wellbores, and the nearest general wellbore based on :
|
| Second Nearest Wellbore Information |
Same information as the nearest wellbore but for the second nearest wellbore |