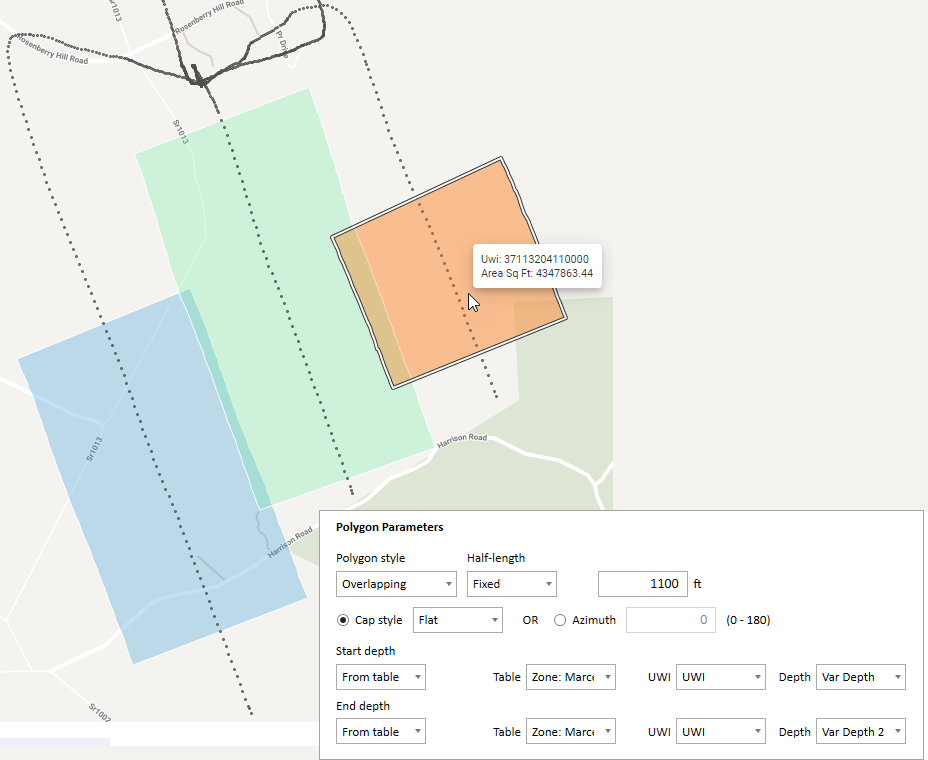
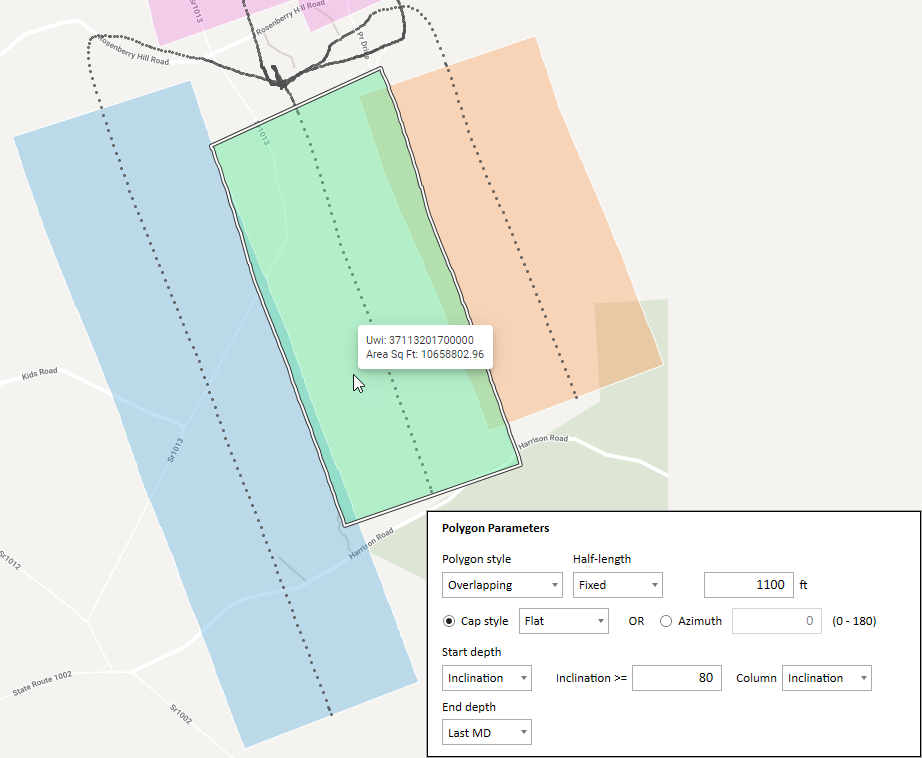
Drainage polygon examples
Hover your mouse over each image to view the drainage polygons and the parameters for each. This is obviously only a sample. There are many possible combinations. Remember that the dialog box stays open, so you can change parameters, click OK, and see the updates on the map. Also remember that a large number of wells could take a very long time to generate.
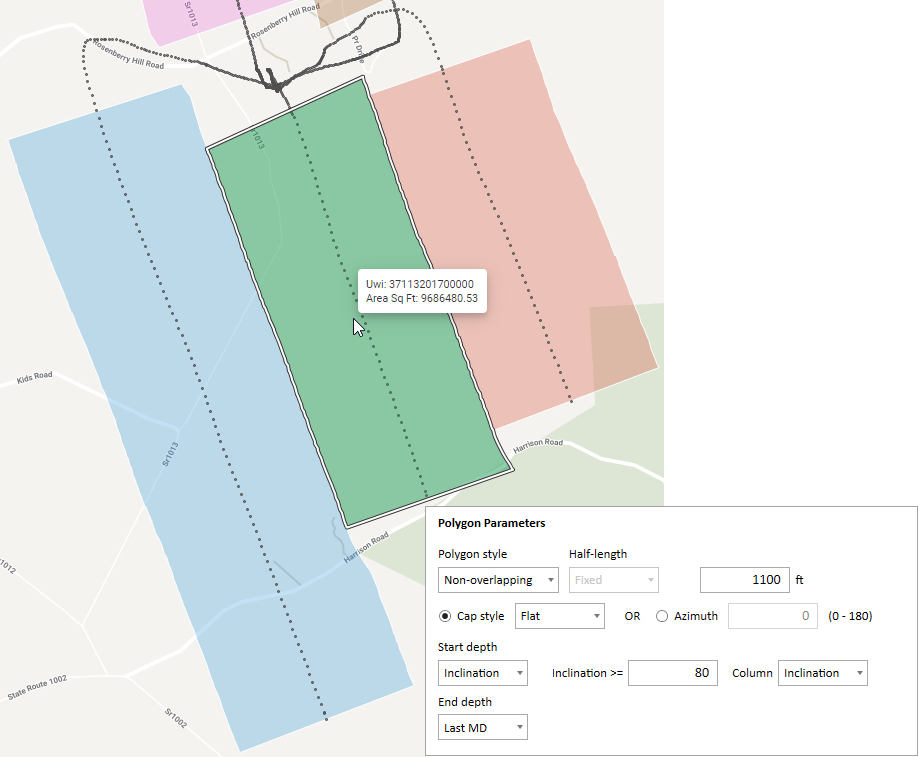
|
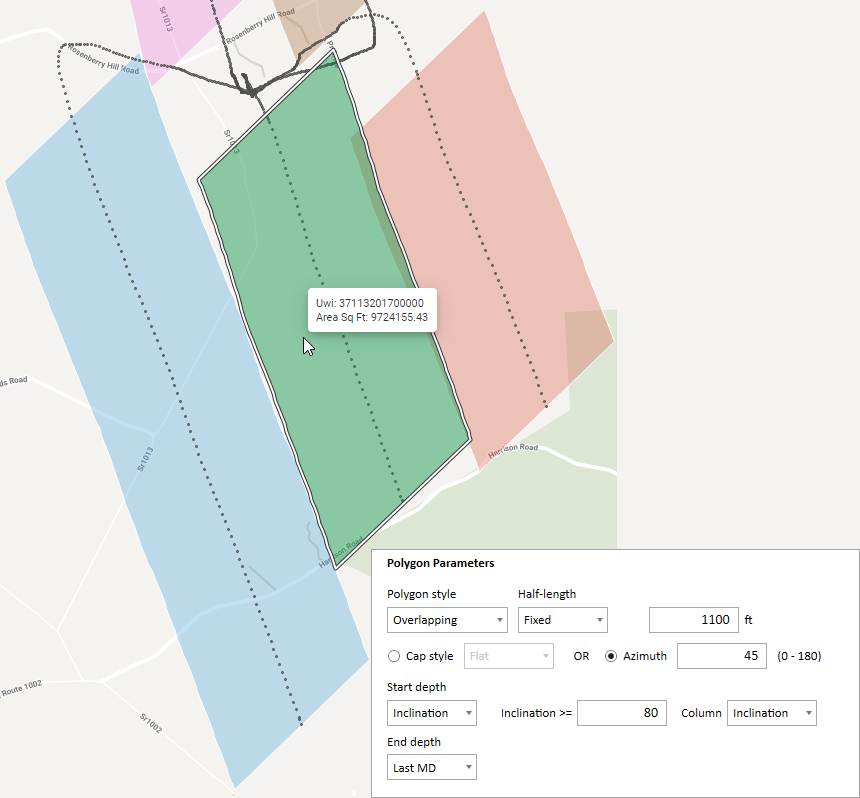
|
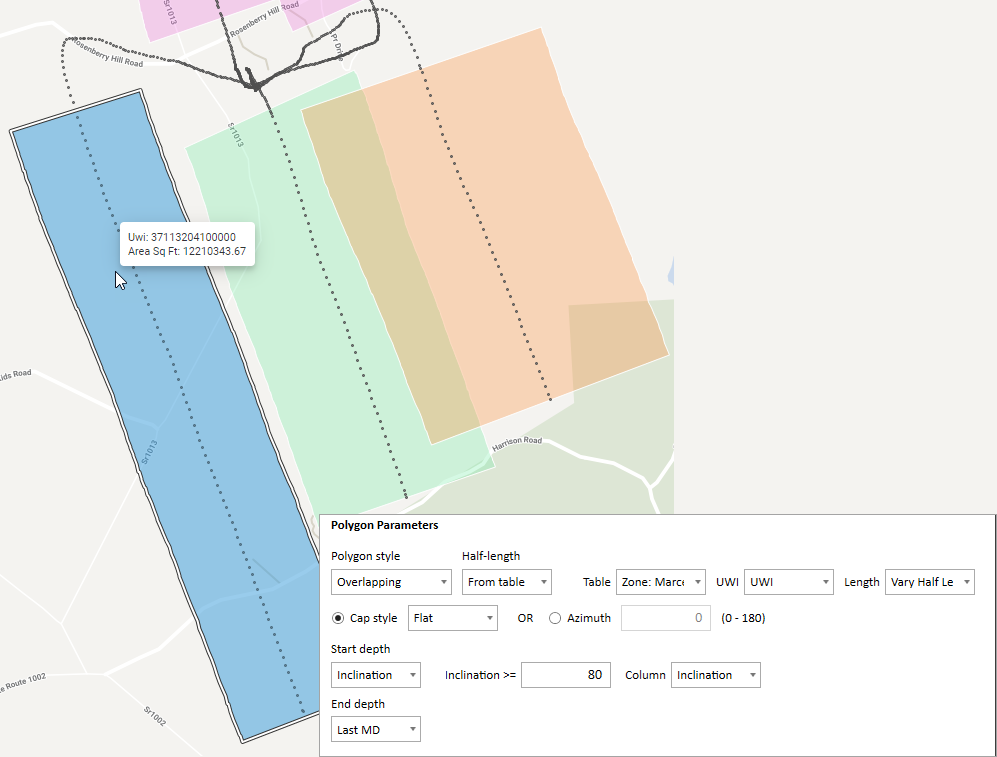
|
|
|
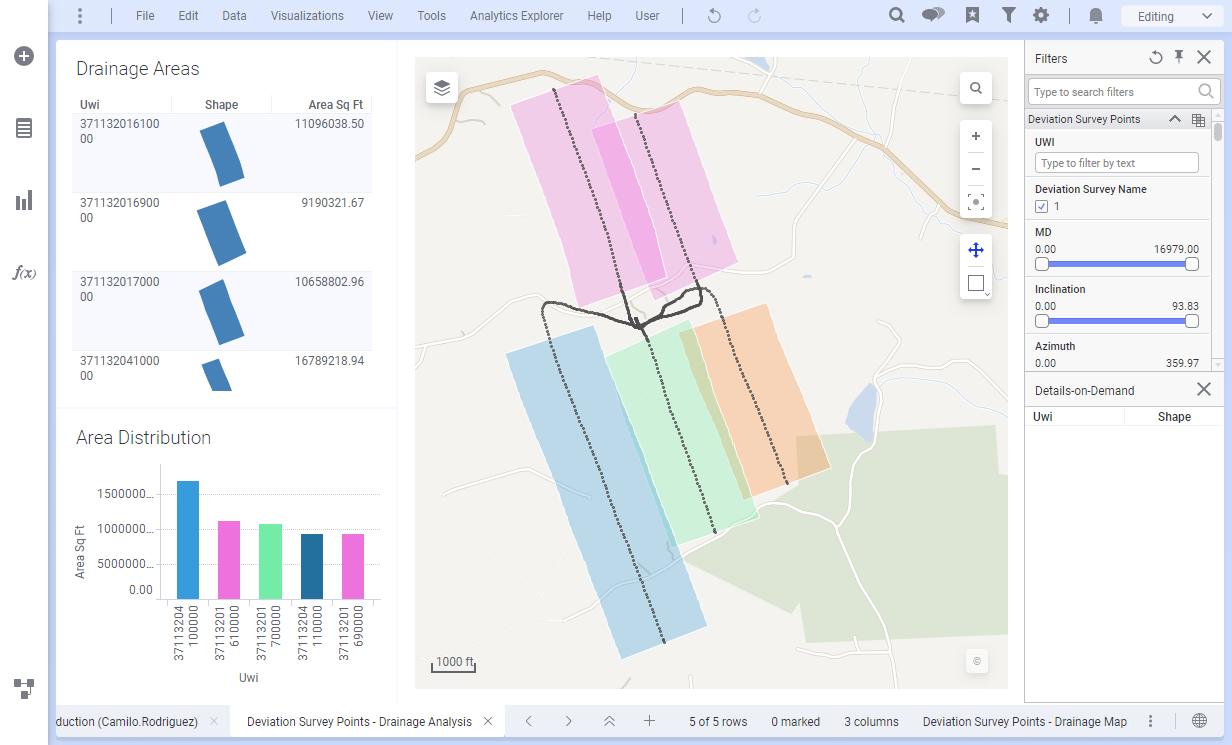
The visualizations include 3 areas as illustrated in the figure below: Drainage Areas, Area Distribution, and the scatter plot displaying the deviation survey points and specified polygon(s).