MLP: Regression
Analytics Explorer runs a regression operation in machine learning when the attribute being calculated is numeric. This algorithm calculates a selected metric based on specified inputs. In this example, the selected metric is the Gas EUR using the Zone table.
Remember to run Attribute Analysis before finalizing your input attribute selection. See Attribute Analysis for more information.
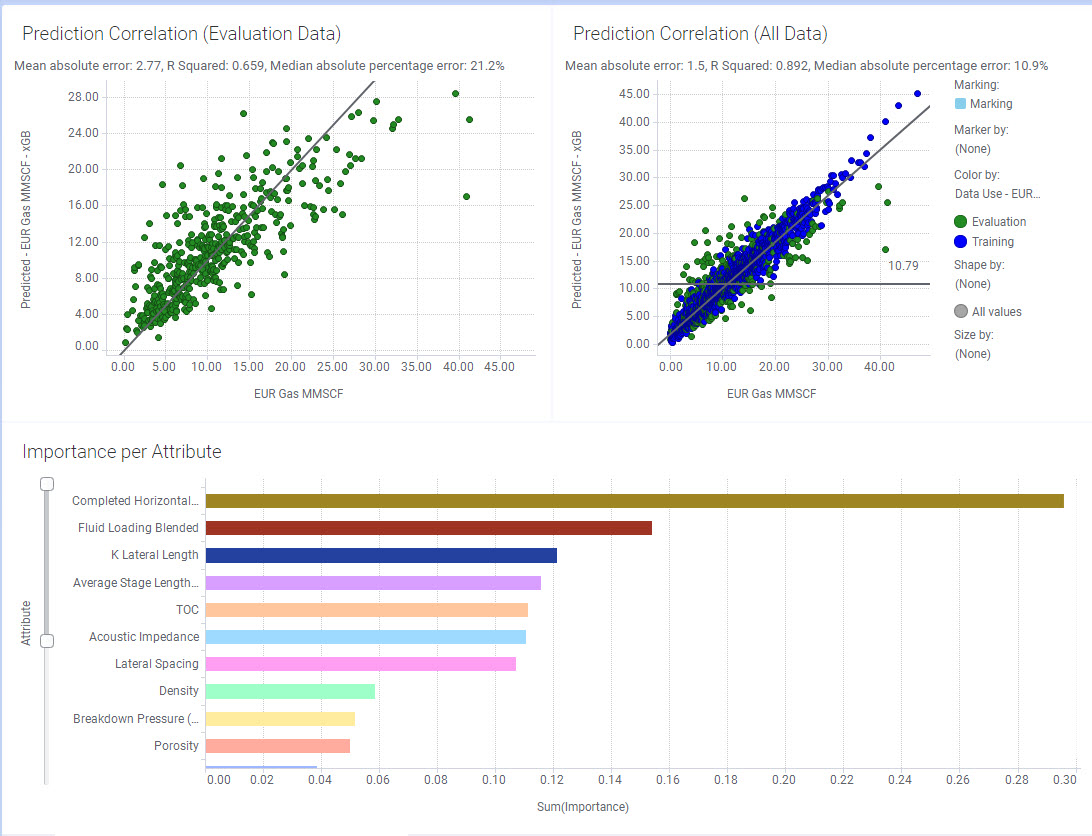
When the calculations are complete, Analytics Explorer opens on the Model Analysis tab. This tab has 3 charts: Prediction Correlation (Evaluation Data), Prediction Correlation (All Data), and Importance per Attribute.

Prediction Correlation
The Prediction Correlation shows the correlation between the actual data and the predicted data. The left plot uses just the evaluation data, and the right plot uses all the data (training and evaluation).
By default we use 80% of the samples to train the model and 20% of the samples to test the model. However, in a non-linear regression problem, the prediction correlation may not be the best indicator. Therefore, the Mean Absolute Error (MAE) is displayed for the metric values displayed on the Y axis.
Both plots show a clear correlation. The goal is to minimize the mean absolute error (MAE).
Importance per Attribute
The Importance per Attribute plot ranks the input features used in a model on how much each feature influences the prediction. Analytics Explorer utilizes Permutation Feature Importance as a technique for feature ranking. For further information see 8.5 Permutation Feature Importance.
Additional information regarding error metrics for ML models
Above each crossplot are key error metrics for you to use when evaluating the performance of machine learning models, providing quantitative measures to assess how well a model predicts outcomes. These metrics play a vital role in determining the reliability and accuracy of models across various tasks, such as regression and classification. Regression error metrics are used to evaluate predictions on continuous data, while classification metrics are employed for discrete class predictions. Among the most widely used regression metrics are R² (Coefficient of Determination), MAE (Mean Absolute Error), and MedAPE (Median Absolute Percentage Error).
It is important to note that no one metric is universal when evaluating your machine learning model, and it is best to understand each metric and the information it provides regarding the performance.
R² measures the proportion of variance in the target variable that can be explained by the model and helps gauge the model's explanatory power.
R2=1−Total Sum of Squares (TSS)Sum of Squared Residuals (SSR)
MAE calculates the average magnitude of errors in predictions, offering a straightforward interpretation of the prediction error in the target variable's units.
MAE=n1i=1∑n∣yi−y^i∣
MedAPE, on the other hand, evaluates the median of absolute percentage errors, making it particularly robust in the presence of skewed distributions or outliers.
MedAPE=median(∣yi∣∣yi−y^i∣×100)
Each metric has its strengths and limitations, and the choice of which to use depends on the characteristic of the data, and how you intend to communicate the error of the model to others. For instance, while R² is useful for understanding overall model fit, MAE and MedAPE are more intuitive and robust for assessing the average and median errors, respectively.
In classification problems, evaluating model performance requires metrics that reflect its ability to correctly predict class labels. Two common metrics are Accuracy and the F1 Score, each suited to different scenarios based on the dataset's characteristics.
Accuracy measures the proportion of correctly classified instances out of the total number of instances. It is calculated as:
Accuracy= (True Positive (TP)+True Negatives (TN)) / (True Positive + False Positive + True Negative + False Negative)
Accuracy is intuitive and easy to interpret, making it useful when the class distribution is balanced. However, it can be misleading in datasets with significant class imbalance, as it may reflect high performance even when the model predominantly predicts the majority class.
F1 Score, on the other hand, provides a harmonic mean of precision and recall, balancing the trade-off between these two metrics. Precision measures the proportion of correctly predicted positive instances out of all predicted positives, while recall measures the proportion of correctly predicted positive instances out of all actual positives. The F1 Score is given by:
F1 Score=2⋅((Precision+Recall)/(Precision⋅Recall))
This metric is particularly effective when dealing with imbalanced datasets, as it accounts for both false positives and false negatives. The F1 Score emphasizes the importance of correctly predicting minority class instances while minimizing incorrect predictions.