Auto-Machine Learning
The Auto-Machine Learning algorithm determines the "best model" where the best model includes the algorithm (see available algorithms below) and thebhyper-parameter values that minimize the metric of your choice. The default is Median Absolute Percentage Error (MedAPE), but others are available depending on your choice of model accuracy.
You can use the results of Auto-Machine Learning to complete the Prediction Algorithm & Settings before running the Machine Learning Prediction.
The available algorithms are the following:
-
Gradient Boosting
-
Random Forest
-
Neural Network
-
eXtreme Gradient Boosting
-
Linear Regression
Each algorithm is described in the Prediction Algorithms & Settings .
The visualization includes the following:
|
A table displaying the optimal algorithm, the MAPE, and the values for they hyper-parameters: learning rate, number of trees, subsample, and minimum samples per node. |
|
|
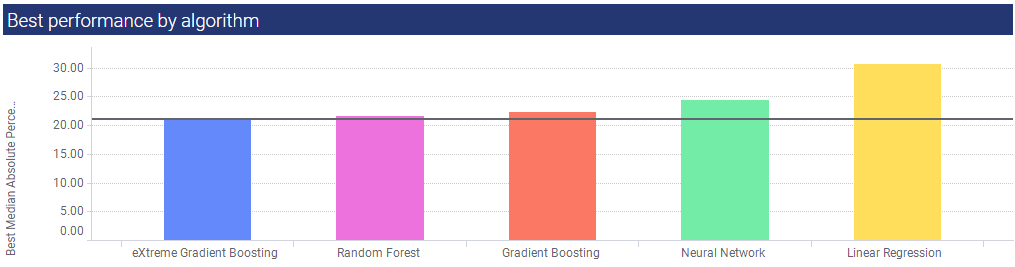
A bar chart with the MAPE for each selected algorithm from lowest to highest (left to right). |
|
|
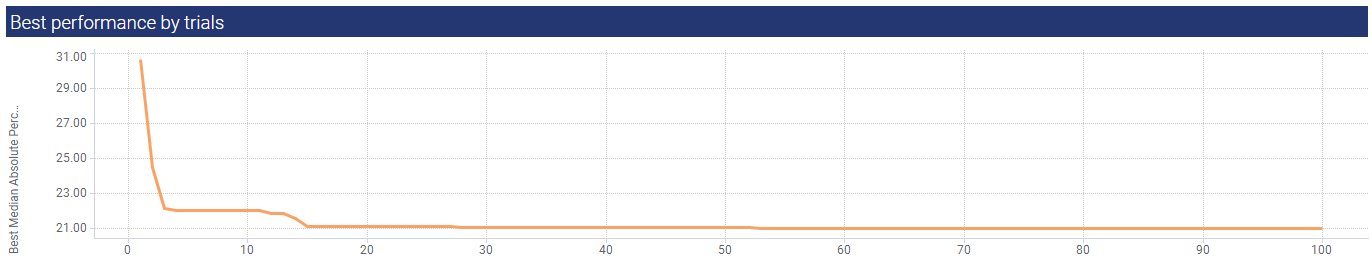
Plots the MAPE values for the "best" algorthm (displayed in the Best model panel) against the number of trials, with the optimum number of trials being those with the lowest MAPE values. |
|
|
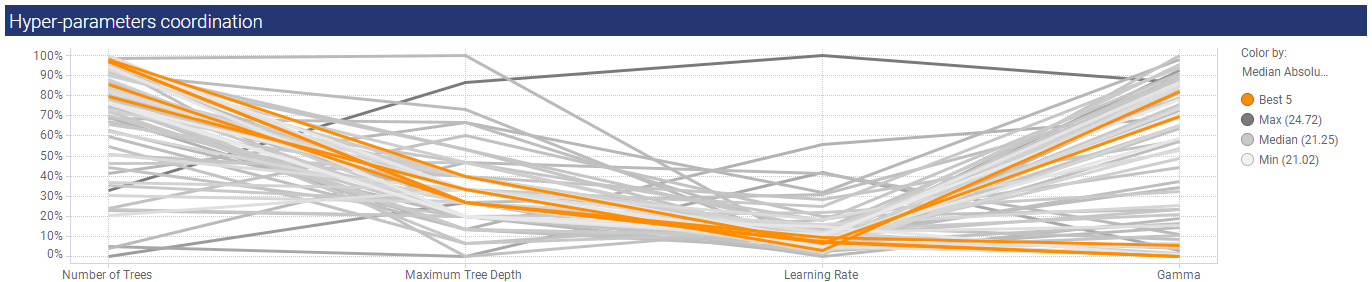
Plots a hyper-parameter line plot for the 5 best models for the best algorithm. The Y axis is a combined normalized scale of each hyper-parameter with 0 being the lowest value, and 100 being the highest. See the visual plots for a description. |
|
|
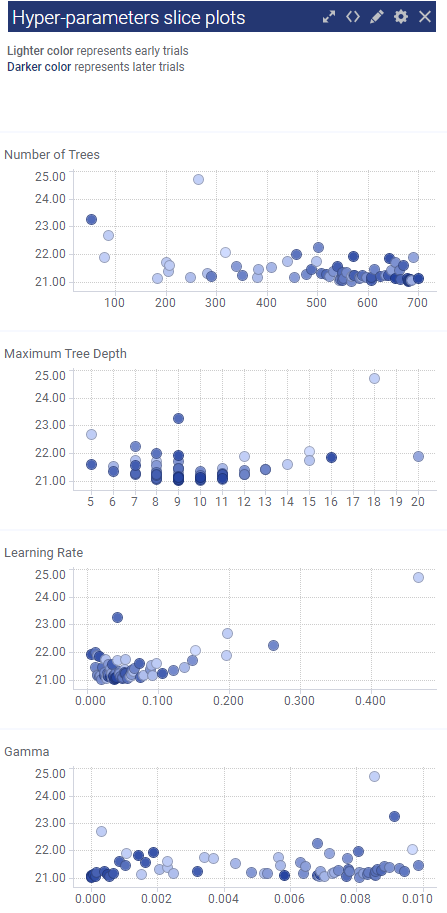
Plots the MAPE on the Y axis against the hyper-parameter actual values using a light to dark shading of the dots to indicate the number of trials; the darker blue represents later trials. This is important to understand if there was bias in the trials. Again, see the visual plots for a description. |
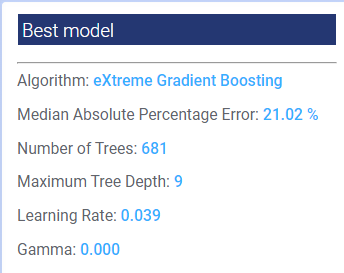
Best model
The Best model panel in the upper-left of the visualization summarizes the key information. In the example below, the algorithm that minimized the median absolute percentage error (MedAPE) is eXtreme Gradient Boosting with a MAPE of 21.02%. The related hyperparameter values that minimize the MedAPE are also listed.
Best performance by algorithm
This bar graph gives the MedAPE scores for each of the algorithms. In this example, eXtreme Gradient Boosting had the lowest MAPE score, and Linear Regression the highest.
Best performance by trials
This line graph plots the MedAPE agains the number of trials for the "best' algorithm, in this case eXtreme Gradient Boosting. In the example below, the MAPE score dropped precipitously after 3 trials. The next drop was after approximately 15 trials after which point successive trials made little to no impact on the MedAPE score.
Hyper-parameters coordination
This line graph is a little trickier to interpret. The Y axis is a combined normalized scale of the hyper-parameters with 0% being the lowest hyper-parameter value, and 100% the highest. All plots are based on the results from the "best algorithm", in this case eXtreme Gradient Boosting. Moving from left to right, you see the 5 best trend lines highlighted in orange.
Hyper-parameters slice plots
The slice plots validate the hyper-parameters used in earlier vs later trials. For example, you can see in the Number of Trees slice plot that both earlier and later trials cluster heaviest between 600 and 700, which makes sense as the best model using eXtreme Gradient Boosting had 681 as the optimal number of trees/ However, also note that in a later trial, the model tested a value around 50, showing lack of bias during the testing process.