Compute Zones
This tool is a very convenient way to see the zone designation of deviation survey points based on computations using input grids in stratigraphic order. Note that you do not need to have grids loaded into Kingdom Analytics. The computation is done in Kingdom using the same computation available from Well Explorer through the Percentage in Zone function in Zone Computes.
This computation is run on the Deviation Survey Points data in Kingdom Analytics. It outputs the zone of each deviation survey point based on the zones created by the input grids, so gives a much granular result than the Well Explorer calculation.
To compute zones from grids and view in a scatter plot:
- In the data connector, in addition to your wells select the following data types:
- Row Data—Deviation survey points
- Table Data—Zones (and specific zones in the following dialog box)
- Select Tools > Kingdom Analytics > Compute Zones from Grids.
- All grids in the project are listed on the left. Move the desired grids to the right in stratigraphic order.
- Click OK to begin the computation.
- Now create a scatter plot of the Deviation Survey Points data:
- Add a page and select the Scatter Plot visualization.
- For Data Table select Deviation Survey Points.
- Click on each axis and set the axes to the X and Y attributes respectively.
- Right click on the map and select Properties. Now select Size on the left and reduce the size to the minimum value. This will adjust the boreholes from circles to sticks on the map.
- Select Color by > Zone from Grid. The wellbores on the plot will update and show the zones along the boreholes.
To zoom in, display the zoom sliders on the axes. Right click on each axis and select Show Zoom Slider. You can then move the sliders to narrow your view
To view wellbores in a 3D scatter plot:
- An effective visualization of zones along the borehole is the 3D Scatter Plot, best suited to a smaller subset of wells. Use the Zoom Sliders to zoom in to the boreholes of interest.
- Right click anywhere on the visualization and select Create Detailed Visualization > 3D Scatter Plot and select Deviation Survey Points for the related data table. The 3D crossplot will open in a visualization below the deviation survey points.
- Now on the original crossplot, highlight the subset of wells. The points will plot on the 3D Crossplot.
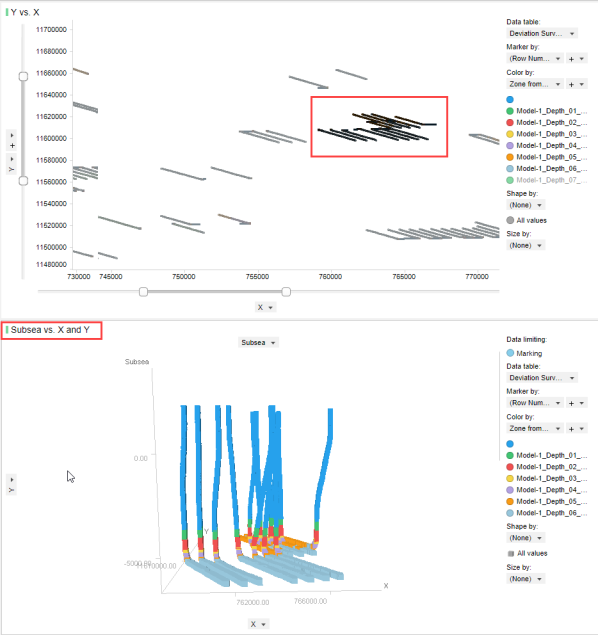
- Set the third axis to Subsea. To rotate the 3D crossplot, place your cursor on the plot and click Ctrl+RMB.