Well Spacing
The well spacing workflow is based on Kingdom project data using the well spacing Spotfire template which provides visualizations and summary tables to analyze the results after the well spacing computation.
At every deviation survey point, Kingdom Analytics computes the nearest distance in either 2D or 3D. Three examples are provided in the picture below regarding the recorded distance for a specific point. The green circle corresponds to the Distance Cut off (if not any nearest well is reached after the specified distance cut off, then the recorded distance for that point will be equal to the distance cut off defined by the user).
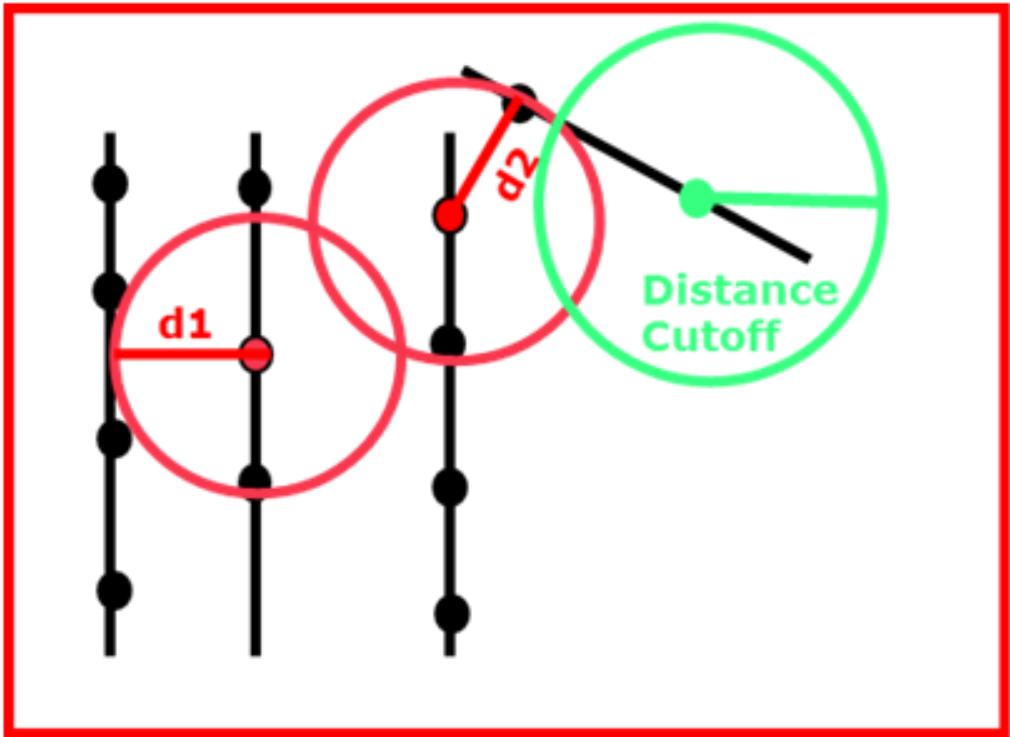
When targeting stack formations, this computation can also be done in 3D, accounting for Z value.
To run the well spacing workflow:
Begin your well spacing workflow by opening the template
-
Start Analytics Explorer and open the well spacing template
Kingdom_Well_Spacing_Spotfire_10.3.dxp. The default installation directory for all templates is the following:C:\ProgramData\IHS Markit\Analytics Explorer\Kingdom TemplatesNote that you can open Analytics Explorer from within the Kingdom project, or you can connect to the Kingdom project data from Spotfire:
-
From Kingdom: Geology > Analysis > Analytics Explorer
-
From Spotfire: Tools > Kingdom Analytics Explorer > Select Kingdom data
-
-
The Kingdom data selector shows two tables selected: Borehole Data and Deviation Survey Points. Make sure you select the well subset that contains the deviated wells to analyze.
-
In the Deviation Survey Points table, highlight the wells you want to run the calculations on in the scatter plot, right-click and select IHS Markit Analytics Explorer > Compute Well Spacing.
-
In the Well Spacing dialog box, select the type of calculation and specify the
Once the computation has been run, this task can be performed on any scatter plot in the template.
-
Enter the desired parameters and the start inclination point for all the deviation surveys and click Compute.
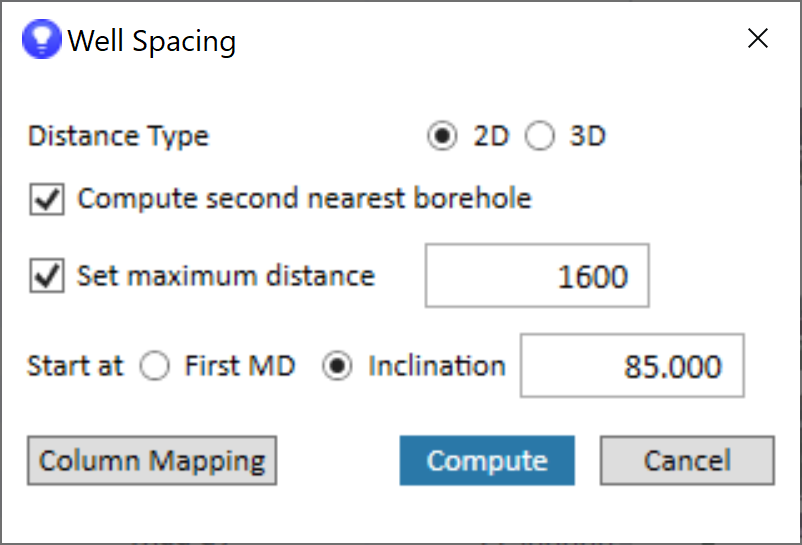
Please be aware that this computation is very extensive and can take from minutes to hours depending on the number of wells you are selecting.
The resulting visualizations open in the new Well Spacing tab and includes 4 graphs:
| Y vs X | The wellbore sticks plotted on a Y vs X crossplot. The wells selected for the well spacing computation are highlighted. |
|
Y vs X Subsea |
An 3D graph of the selected wellbores if the 3D option was selected. The section of the wellbore included in the calculation is highlighted. |
| Nearest Wellbore Information |
The data in table format showing the following measurements to the nearest wellbore, the identifiers of the nearest heel and toe wellbores, and the nearest general wellbore based on :
|
| Second Nearest Wellbore Information |
Same information as the nearest wellbore but for the second nearest wellbore |