Eigenvalues Graph
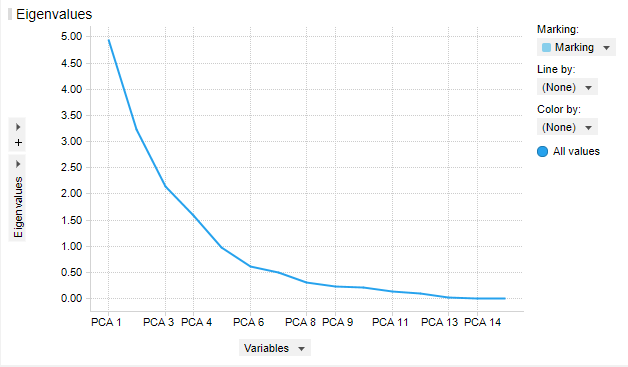
Recall that eigenvalues reflect the variance of the data. Large eigenvalues correspond to large variances.
In the Eigenvalues graph below, the eigenvalues drop from 5.00 to 2.00 after PCA1 and PCA2. In other words, the first and second primary components can account for over 50 percent of the data variance. The first 5 primary components explain 80% of the variation in the data.