Multiple Reservoir Analysis
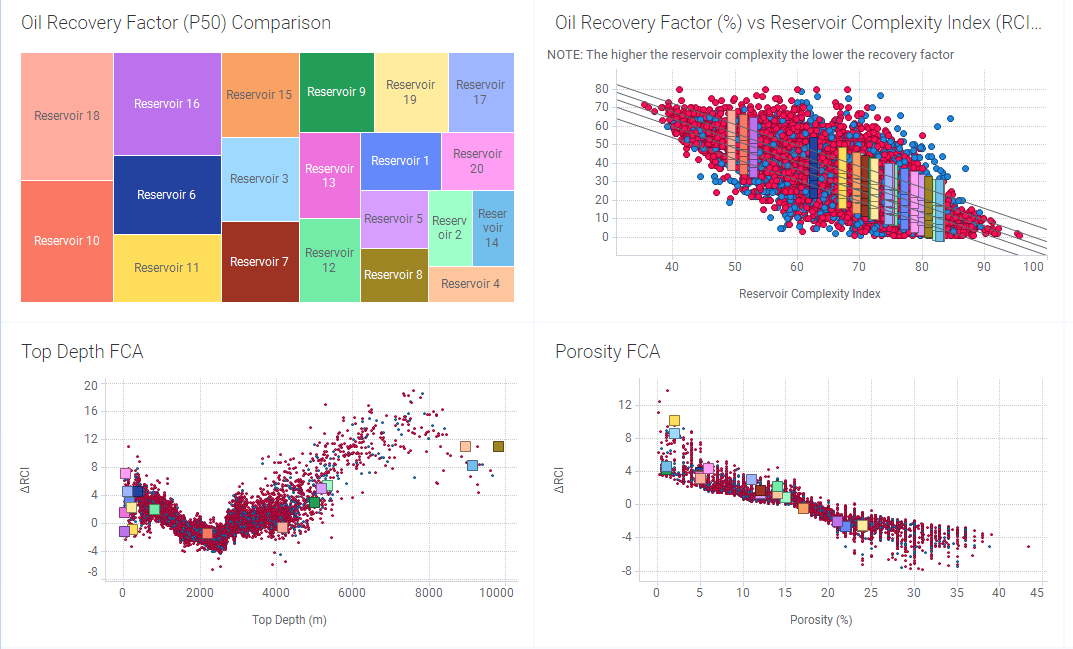
The Multiple Reservoir Analysis scatter plots have the same global reservoir data and FCA charts, but include a point for each reservoir in the selected multi-reservoir table. The upper left chart shows all reservoirs in the selected table sized by the P50 Oil Recovery Factor. Each reservoir is assigned a color. These colored bars/squares indicate the corresponding reservoirs' position within the global trend in each of the scatter plots. Hover over the point to display the reservoir details.