3D Viewer
The 3D Viewer displays the following data types along the borehole. The easiest way to understand the view is to hover over objects and read the details. You will probably need to zoom in to see objects clearly. Zoom in with the center mouse wheel.
|
Note |
For data types that are read from the host application, these data types are not saved in the Frac Explorer database. They are only retrieved on demand. In the current release, the only host application is Kingdom. |
Borehole | The borehole display color is gold. If you hover over a section of the borehole, a text box displays the MD and TVD of the current segment from the deviation survey. |
Bounding Box | The main grid that displays the depth, latitude, and longitude. |
Cardinal Directions | The direction labels can help orient the view. The color, size, and position of the labels cannot be customized. |
Casing | Casing data is read from the host application project database. You can review casing data on the Drilling Events tab in Well Explorer. |
Color legends | The Graph and the Digital Log each have an associated color bar. The color bar cannot be edited. |
Depth Label | The MD and TVD of the borehole is displayed perpendicular to the borehole |
Digital Log | Digital log data is read from the host application project database. You can also view the borehole's digital logs in Well Explorer |
Formation Tops | Formation top data is read from the host application project database. |
Graph | Graphs of the completion statistics for each stage. |
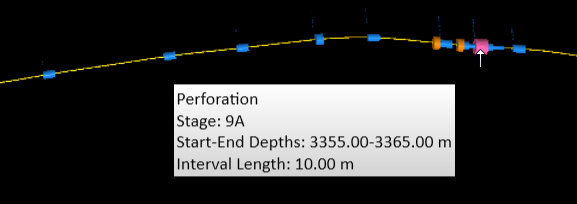
Perforations | The perforation range displays as a cylinder around the borehole. If the perforation header does not contain individual perforations, then the hover display says Perforation Header. |
Plugs | Plugs display as orange cylinders around the borehole. |
Treatment | Display as blue cylinders along the borehole. |
Treatment Graph | The treatment graph displays as a colored bar to one side of the borehole. To understand the values, turn on the color legend. |
The following 3D Viewer tools can help you customize your view and get detailed information about each element:
- Hover your mouse over any object in the 3D Viewer to display details. The actual object changes color and details are displayed in a text box.

- The top toolbar controls the elements you want to display:

- Show—turn on and off completion elements
- Graph—select the completion graph you want to display. The Graph color legend displays the corresponding numeric values.
- Digital Logs—select a log to display along the borehole. Like Graph, the color legend displays the corresponding numeric values.
- Copy—copies the 3D image to the clipboard
- Reset View—returns you to the position and size of the original 3D image
- Background—select a different background color