Combining logs in tracks
Logs can either occupy separate tracks in the main synthetic display or can share tracks to save work space. GeoSyn enables you to specify the logs to display in up to ten tracks and can display an unlimited number of logs in any track. The same log can be repeated in multiple tracks.
With a left and right log defined in the same track, select the Show cross over option and adjust the horizontal placement of the logs to infill areas where the two logs overlap, or where the curves exceed a given value.
Save composite log layouts with different configurations as templates with a .tpl extension in the GeoSyn Working directory.
To combine logs in tracks:
1. Do either of the following:
If your current synthetic displays multiple logs per track, right-click the track and select Multi-log per track Template properties.
If your current synthetic displays
only single logs per track, from the Edit
menu, select Well and log properties
( ) > Log properties
to display the Log properties
tab and in the Properties common to all
logs pane, select Multiple logs / track then click the adjacent Edit
button.
) > Log properties
to display the Log properties
tab and in the Properties common to all
logs pane, select Multiple logs / track then click the adjacent Edit
button.
The Multi-log per Track Template
dialog box opens.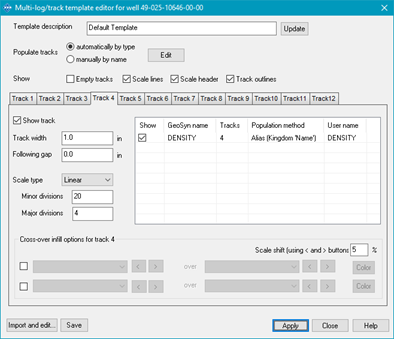
2. For the Populate tracks radio buttons, select either automatically by type (sonic, density, etc), or manually by name (Delta-T, Bulk Density, etc.) depending on the degree of control you want over which logs appear, and then click Edit.
The Multi-log per track layout dialog box opens.
3. For each of the track columns, click the log type to display, and then click OK.
To ensure a log doesn't get dropped, click the All unselected linear logs and the All unselected logarithmic logs options.
The log types selected above are displayed in the various track tabs of the main Multi-log per Track Edit dialog box.
4. Using the Multi-log per Track Edit dialog box, for the tracks to display, click the Track tab, specify whether to show the track and select other criteria such as the track width, scale type, and so on.
5. In the log display pane click or clear Show as depicted below to display or hide a log in a given track.

The Tracks column above displays the tracks in which a log appears. In the example above, the density log can be displayed in track 1. It also appears in track 3. The column to the right of the Log name column specifies whether the log appears in a track by default or was deliberately designated to appear in that track.
To fill areas where curve readings for two or four curves intersect within the same track, select the check box to the left of the drop-down lists in the Cross overs section and then select either logs that appears in your model or select fixed value depending on whether you want to infill where curves intersect, or where a curve exceeds a given value. Manually shift a curve by clicking  to the right of the curve drop-down list to enhance the cross over, or type a percentage by which to shift the log scales.
6. Type a descriptive name in the Template name box and click Save to write the file to the current GeoSyn Working directory with the name GSTemplateX.tpl where X is an incrementing number based on the number of template files already in the Working directory. When importing the template file in the future, whatever is typed in the Template name box appears as the file description.
7. Click Apply to update the current synthetic with your changes.