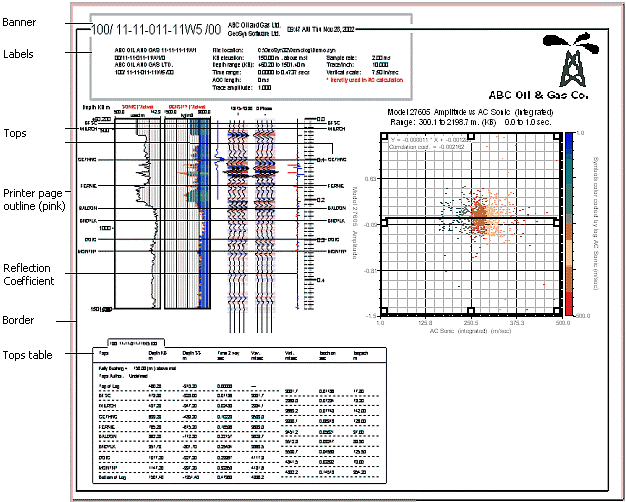
The main synthetic display is where you do analysis. When you launch GeoSyn, the main synthetic display appears as a blank canvas. After you import a log image or launch an existing GeoSyn synthetic, labels, logs, a tops table, and traces appear as depicted below.

Elements in the main synthetic display can be moved, copied to and from the Windows clipboard, hidden, deleted, resized, and configured. Right-click, double-click, or use the main menu to configure individual elements. Drag and drop to reposition them on the canvas. If you resize an element larger than the canvas, the canvas automatically resizes to accommodate the new size.
Any number of logs defined as sonic or density may be included in a synthetic, but GeoSyn only uses a single sonic and a single density to create the synthetic. These logs are called the active sonic and active density, and are clearly labeled on the main synthetic display. The active sonic and density logs control the generation of the synthetic.
Transfer the active status to any log (not just other sonic or density logs). Transferring the active status is ideal for modeling purposes, because it enables you to rapidly shift between sonic and density logs representing different geological scenarios.
