General tab
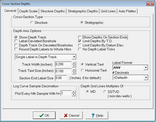
The Cross-Section Depths window controls how well depths are displayed. This includes setting cross sections as structural or stratigraphic, setting the vertical depth scale and interval range.
To open the Cross-Section Depths window:
- Cross section: Depths > Depth Scale...
- Depth button
 on the cross section module toolbar. on the cross section module toolbar.
|
|
Cross section type
|
- Structural Depth interval is defined by upper and lower measured or sub-datum depths.
- Stratigraphic Depth interval is defined using formation tops. The upper top is treated as the relative datum and appears as a "flattened" surface.
|
|
Show Depth Track
|
Plots depths and depth ticks inside the depth track.
|
|
Label Deviated Borehole
|
Labels deviated well bores.
|
|
Depth Track on Deviated Boreholes
|
Adds a MD depth track for deviated wel lbores.
|
|
Round Depth Labels to Whole Nbrs
|
Rounds depth labels to the nearest whole number rather than leaving a decimal.
|
|
Show Depths on Section Ends
|
Displays depth ticks at the left and right edges of the cross section. For structural cross sections, these values will be in the depth range selected on the "Structure Depths" tab. For stratigraphic cross sections, these values will reflect the distance in feet or meters away from the top defining the upper depth limit.
|
|
Limit Depths By T.D.
|
prevents well tracks and data from plotting below the well's TD specified on the Main Module's Wells tab. This can be useful for more accurately visualizing the depths penetrated by each well.
|
|
Limit Depths By Datum Elev.
|
Prevents well tracks and data from plotting above the well's datum elevation specified on the Main Module's Wells tab. This can be useful for more accurately visualizing the surface elevation for each well.
|
|
No Depth Label Ticks
|
Prevents depth label ticks inside the depth track
|
|
Single/Dual Label(s) in Depth Track
|
Displays only the label specified in the "Depth Grid Lines Multiples of" option in the depth track (MD or SSTVD). The "Dual Labels" option displays both MD and SSTVD labels.
|
|
Track Width (inches)
|
Sets the width of the depth track.
|
|
Track Text Size
|
Sets the size of the depth track labels.
|
|
Section End Label Size
|
Sets the size of the depth labels on the left and right edges of the cross section.
|
|
Vertical/Horizontal Text
|
Specifies whether the depth labels inside the depth track are vertical or horizontal. Most users will find horizontal text too cluttered.
|
|
Label Format
|
Specifies how Petra plots depth labels. Options include simple numbers, a comma delimiting units of 1,000, and the addition of a " ' " for feet or "m" for meters.
|
|
# of Decimals
|
Selects the number of decimals in the depth labels.
|
Log Curve Sample Decimation
This option decimates log curves. A value of 1 plots all log samples in the depth interval, while a "2" plots every other sample and "3" plots every third sample. This can be useful for reducing the jittery character of greatly compressed log curves.
Depth Grid Lines Multiples of
This option changes how Petra displays depth grid lines. With the MD option selected, the "Single Label in Depth Track" will display only MD. With the SSTVD option selected, the "Single Label in Depth Track" will display only SSTVD.
Depth Scale
|
|
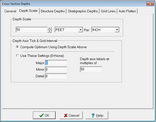
Depth Scale
|
Sets the vertical exaggeration of the cross section. Note that the scale can be set in either imperial or metric units.
|
|
Compute Optimum Using Depth Scale Above
|
Attempts to automatically calculate reasonable major and minor grid lines. This is a good default option for most users.
|
|
Use These Settings
|
Draws major and minor lines based on user settings.
|
Depth Scale tab
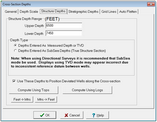
This tab sets the depth interval when the "Structure" depth type is selected on the General tab.
|
|
Upper Depth
|
Sets the upper depth for the cross section. These values can be in MD, TVD, or SS.
|
|
Lower Depth -
|
Sets the lower depth for the cross section. These values can be in MD, TVD, or SS.
|
|
Depth Type
|
Sets the type of the depths in the Upper and Lower Depth fields. MD and TVD will increase from the datum, while SS will be relative to sea level.
|
|
Use These Depths to Position Deviated Wells along the cross section
|
Adjusts the position of directional and deviated wells to produce a more accurate portrayal of the wellbore.
|
|
Compute Using Tops
|
Selects a depth range that will display all the the currently displayed formation tops
|
|
Compute Using Logs
|
Selects a depth range that will display all the the currently displayed digital logs.
|
Stratigraphic Depth tab
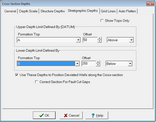
This tab sets the depth interval when the "Stratigraphic" depth type is selected on the General tab. Select the formation tops which define the upper and lower depth.
|
|
Use These Depths to Position Deviated Wells along the cross section
|
Adjusts the position of directional and deviated wells to produce a more accurate portrayal of the wellbore.
|
|
Correct Section for Fault Cut Gaps
|
Uses the fault cuts in the database to attempt to correct for missing section on the stratigraphic cross section.
|
Grid Lines tab
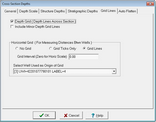
The Grid Lines tab adds vertical lines and horizontal lines across the cross section. These lines can make it easier to visualize depths and the distance between wells.
|
|
Depth Grid
|
Draws horizontal lines across the cross section using the "Major" settings set on the Depth Scale tab.
|
|
Include Minor Depth Grid Lines
|
Draws horizontal lines across the cross section using the "Minor" settings set on the Depth Scale tab.
|
Horizontal Grid
This option draws vertical lines between the wells to signify distances between wellbores in XY units. Note that these lines will only make sense with a well spacing that's relative to XY Location.
|
No Grid
|
Does not draw any vertical lines.
|
|
Grid Ticks Only
|
Draws only ticks along the bottom of the cross section.
|
|
Grid Lines
|
Draws full vertical lines extending from the bottom of the cross section to the top.
|
|
Grid Interval
|
Sets the interval of the horizontal grid lines. Setting this entry to 1000 will draw vertical lines every 1000 XY map units (feet or meters)
|
|
Select Well Userd as Origin of Grid
|
Selects the origin, or 0, of the vertical lines. By default, Petra selects well on the far left as the origin.
|
Auto Flatten tab
The Auto Flatten tab controls how Petra creates stratigraphic cross sections from the "Flatten on..." command when right clicking on a top.
|
Adjust Depths to Show All Displayed Tops
|
Automatically creates a depth range that displays all selected tops.
|
|
Adjust Depths Using Offsets From Flattened Top
|
Uses the selected offsets above and below the top.
|
|