Displaying Digital Logs Workflow |
Top Previous Next |
|
In the Profile View, there are a number of tracks in which digital logs can be displayed:
Side Track (on the left side of the window) 5 sub-tracks for digital log data Bottom Track 5 sub-tracks for digital log data Along wellbores (either vertical or horizontal) 1 track on each side of each wellbore
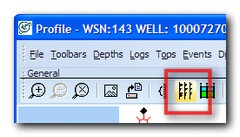
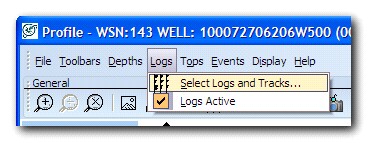
To open the Log Display Options Dialog, from the Profile View, click the Digital Logs and Tracks Dialog button on the icon bar, or in the menu bar, choose Logs > Select Logs and Tracks:
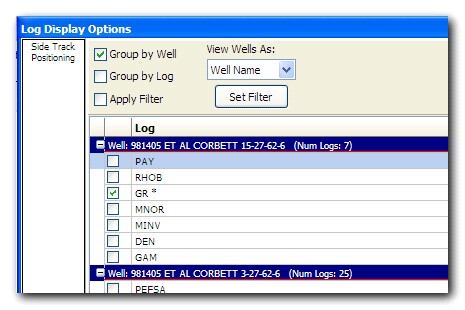
Log Display Options Dialog
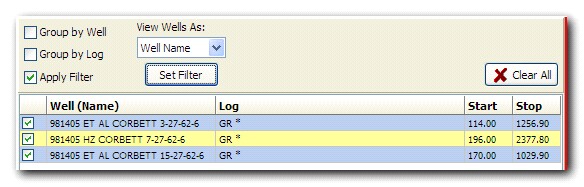
1 Side Track Preview 2 Grouping, Filtering, and Well Name Display options 3 Wells and Logs 4 Selected Log Statistics 5 Bottom Track Preview 6 Settings for selected digital log 7 Side and Bottom Track Settings When the Log Display Options dialog opens, it will automatically display all wells selected in the Profile view and the digital logs loaded into the Petra database for those wells. In the top bar (#2 in the image above), you can select various grouping and filtering options to quickly locate the wells and logs of interest to you: Group by Well:
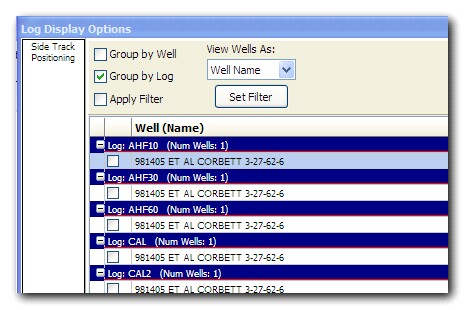
Group by Log:
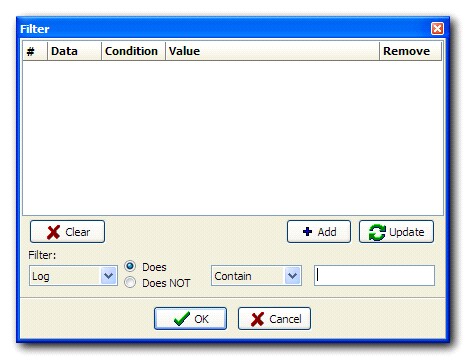
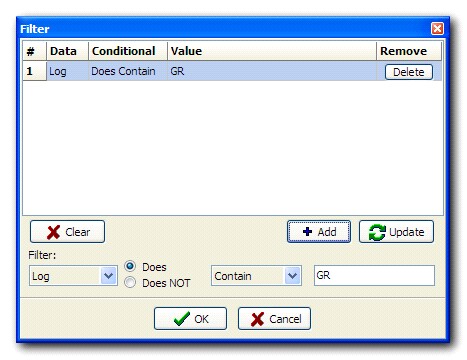
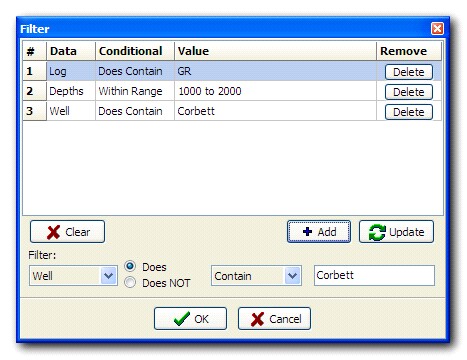
Apply Filter: Apply Filter opens the filtering dialog. In this dialog you can create filters to only show the logs of interest:
To create a filter:
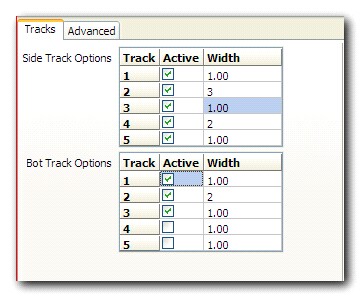
Track Settings To change the widths of the tracks, use the lower right portion of the dialog. There are 5 tracks available in the side track and bottom track.
To activate a track, click its Active checkbox. You can also adjust the width (in inches). Changes to the number and widths of tracks activated will be shown in the track previews:
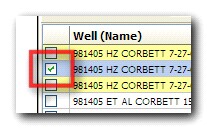
Changing Digital Log Settings To activate a digital log, click the checkbox next to its row in the table.
The blue highlight on the row selected indicates that you are working with that log curve in the settings panel on the right. To change the style and track settings of a different curve, simply click on its row to move the blue highlight color. To change the style and track settings of multiple curves at the same time, simply control-click or shift-click on multiple rows. Settings will apply to all selected wells when you press Apply.
To uncheck all digital logs that have been enabled, press the Clear All button.
Log Curve Settings
In the settings panel on the top right, the following tabs are available. Again, these settings all apply only to the well or wells highlighted in blue in the well and curve list.
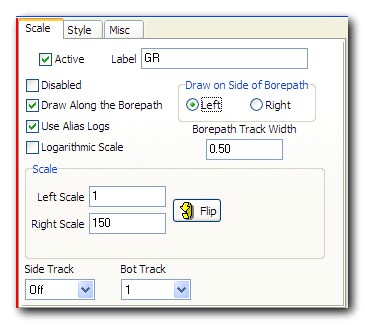
The Scale tab is primarily used to select the log track and log scale limits. Scaling options apply to the highlighted log name in the wells and logs portion of the dialog (blue highlight).
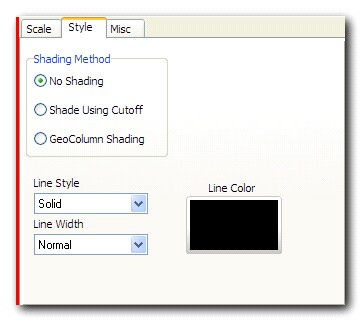
The Style tab defines the appearance of each log trace. Color, line width, line style and shading options are provided. Color and style options apply to the highlighted log name in the wells and logs portion of the dialog (blue highlight).
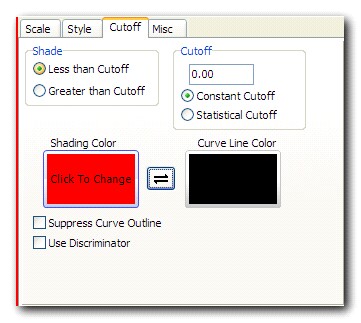
The Cutoff tab provides options relating to how a log is shaded based on a user-defined cutoff value. Two colors are used to plot the log trace - one for values below the cutoff and another for values above the cutoff. Shading can occur below or above the cutoff value.
CUTOFF = MEAN + (SD x USERVALUE)
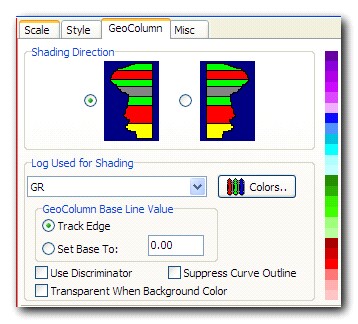
The GeoColumn tab provides options for displaying a curve using "GeoColumn" shading. The GeoColumn feature shades a curve with multiple colors based on curve values.
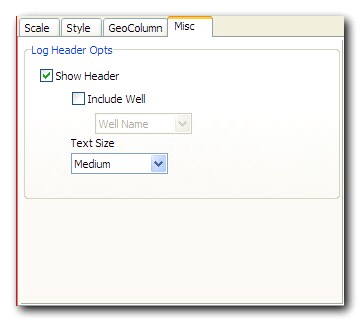
The Misc tab provides options for configuring the header for each curve in the track.
Pressing the Apply button will update the Profile View with all of the changes you have made. You may need to move the dialog to the side to see the Profile View. The changes are not permanent until the OK button is pressed, which closes the dialog.
Advanced Options for Digital Log Curves Traditionally, when drawing digital logs along a horizontal borepath, the logs may loop back onto themselves when the borepath has a high degree of curvature:
Petra uses advanced functionality to ensure the digital log curve maintains a useful appearance by drawing a tangent line along the borepath and using that line as the track edge for the log curve:
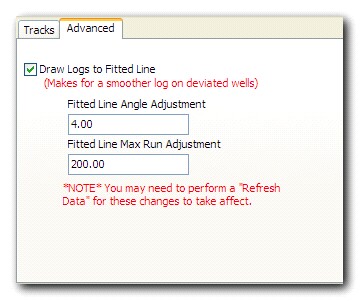
The settings for this advanced functionality can be found in the Track settings Advanced tab.
|