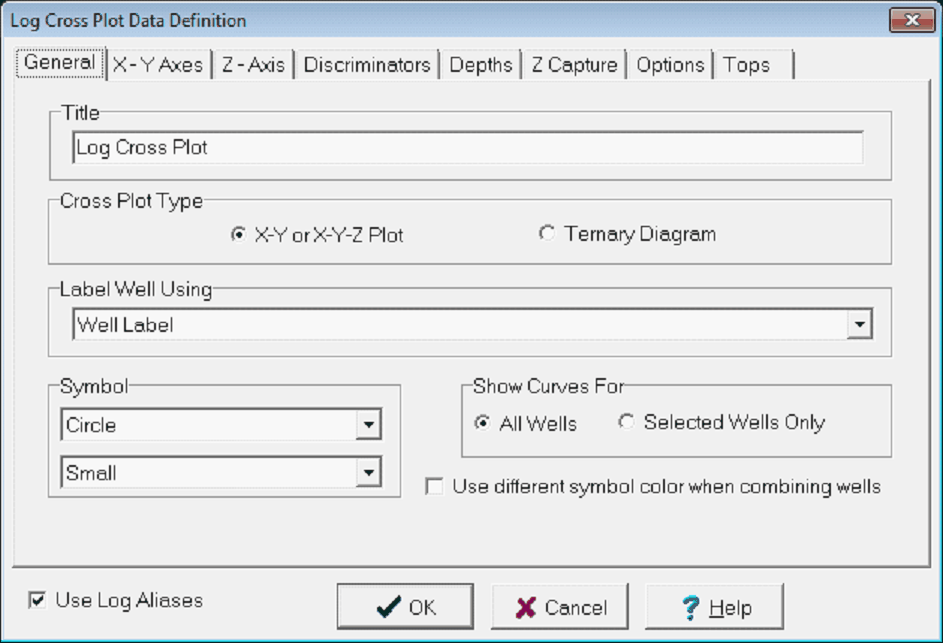
Log Cross Plot Data Definition |
Top Previous Next |
|
The Log Data Cross Plot Data Definition tool sets the X and Y axes, establishes Z color shading, saves templates, and sets titles and labeling. To open the Z Data Cross Plot Data Definition tool, select the
|

