Directional Preview tab |
|
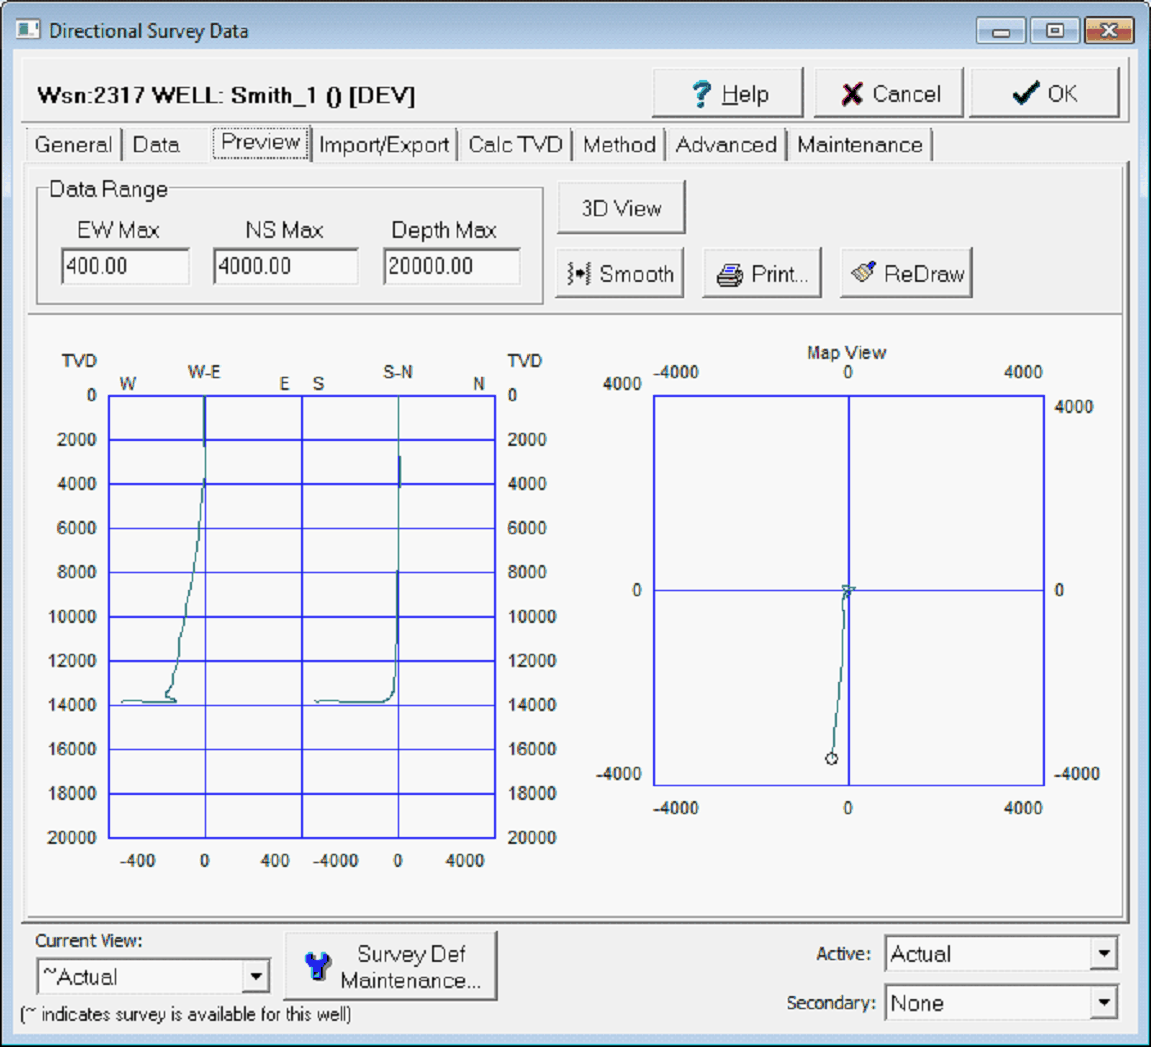
The Preview tab displays projections of the wellbores path in three different planes: EW vs. depth, NS vs. depth, and a map view. This tab also opens a 3D visualization box with the outline of the wellbore.
The Directional Survey Data's Preview tab displaying two cross sections and a map view of a directional well Data RangeThe options in this box set maximum range for EW and NS offsets and vertical depth for the plots. Select the "ReDraw" button after changing the data range. 3D View - This button opens a small visualization tool that displays the wellbore in a 3-dimensional box. This box can be rotated around to illustrate the wellbores path or easily spot bad survey points. The Draw Axes button in the lower right corner adds scales for each axis of the box. Smooth - This button smoothes the survey offsets slightly. Repeat the smooth process for higher degrees of smoothing. Note that this option changes the survey data. Print - This button sends the display to the printer. The display should be printed in landscape format for best results. Redraw - This button redraws the plots with the selected data range. |