Contour A Grid - Advanced tab


This screen offers options for more advanced contouring.  These options are important if you need to edit contours and re-grid using the map overlay contours.

MapContourGridAdvanced

The Contour a Grid window's Advanced tab

Capture Contour For Import to Map Overlay

This option provides a mechanism to save the contour lines as they are drawn.  Once these are in the the overlay, the contours can be modified and used as input to create another grid file.
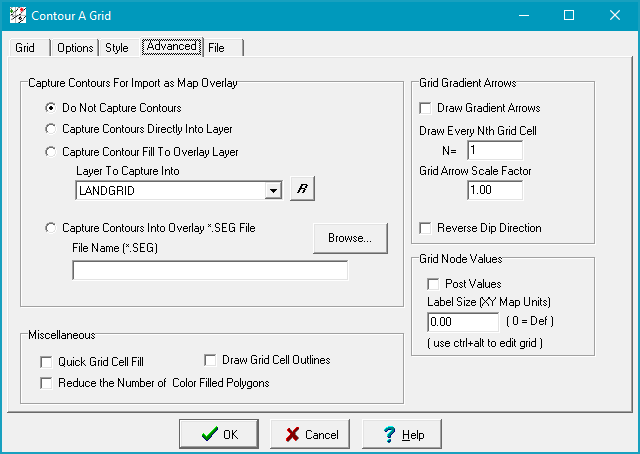
·Do Not Capture Contours—This option draws contour lines and color fills normally, and does not save anything to the overlay file.  This option is on by default.

·Capture Contours Directly Into Layer—This option saves the gridded contour lines to the overlay layer selected in the "Layer to Capture Into" drop down box.  Captured lines will be saved as a "Contour Line" line class, which preserves the contour line's value.

·Capture Contour Fill to Overlay Layer—This option saves a set of closed polygons with the appropriate color fill to the overlay layer selected in the "Layer to Capture Into" drop down box.

·Capture Contours Into Overlay *.SEG File—This option saves the contours to the selected *SEG file.  Use the "Browse" button to select the desired file.

Grid Gradient Arrows

This section plots arrows at grid nodes indicating the direction and magnitude of the slope.

·Draw Gradient Arrows—This option draws arrows at grid nodes.

·Draw Every Nth Grid Cell—This option sets whether and how Petra skips grid nodes for arrows. As an example,  N = 1 plots arrows at every grid cell, while N=3 plots arrows at every third node.

·Grid Arrow Scale Factor—This option sets the length of the gradient arrows.  A scale factor" less than 1.0 shortens arrows, while a scale factor greater than 1.0 lengthens arrows.

·Reverse Dip Direction—This option draws the arrows to point updip rather than downdip.

Grid Node Values

·Post Grid Nodes—This section causes the grid node values to be posted at each grid node location.

·Label Size—Enter the appropriate xy map units or leave the default of 0.0 for labels of 0.1 inch.

Note: When you label grid nodes, you can edit them by double-clicking on a node value while holding down the CTRL and ALT keys. Changes here are made directly to the grid file and there is no undo or backup.

Miscellaneous

·Quick Grid Cell Fill—This option will color fill each grid cell with a single color. Color contour bands are not drawn.

·Draw Grid Cell Outlines—This option causes grid lines to be drawn along each grid row and column.  This can be useful for demonstrating the resolution of the grid relative to the actual data points.

·Reduce the Number of Color Filled Polygons—Combines polygons of the same color in order to not exceed the plotter capacity.  

Note: This is likely no longer an issue as the plotters have gotten smarter and better able to handle large numbers of color filled polygons