|
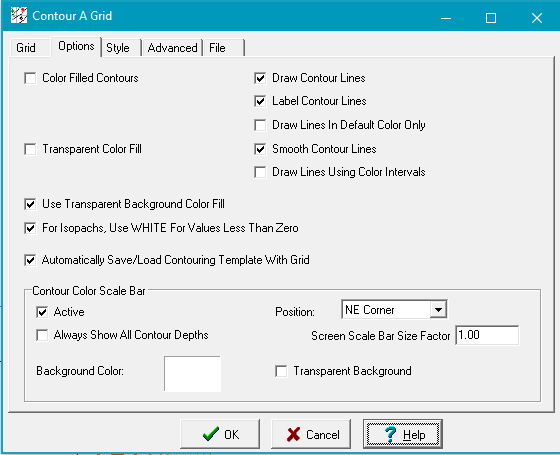
Color Filled Contours
|
This option uses the Color bar set on the Grid tab color-fill the gridded surface.
|
|
Draw Color Scale Bar
|
This option draws a small color scale showing the color associated with each contour interval. The adjacent dropdown selects the location of the scale bar, which can be either on the upper left or upper right side of the map
|
|
Draw Contour Lines
|
This option draws contour lines on the grid. These lines will start at the "Min" contour range on the Grid tab and proceed up to the "Max" contour range using the contour "Interval" value.
|
|
Label Contours
|
This option control whether any contours are labeled. Refer to the style tab for labeling options.
|
|
Draw Lines In Default Color
|
By default, Petra draws contours using the colors from the Color bar. This option instead draws all contour lines using the default color (which is usually black). To change the default color, select Display>Colors on the menu bar at the top of the Map Module.
|
|
Smooth Contour Lines
|
This option smooths contour lines. For jagged or triangular grids, this may force grids to not "honor the data."
|
|
Draw Lines Using Color Intervals
|
Normally, contour lines are drawn at regular intervals, using the minimum, maximum and interval. Contour interval is independent of the color range and intervals specified. This option draws contour lines only at the intervals specified by the color range option. This option can be used to draw contour lines at irregular contour intervals. When checked, the normal contour min, max, and interval are ignored and the color bar intervals are used instead.
|
|
Use Transparent Background Color Fill
|
This option suppresses area filling of contours which match the map's background color, which is normally white. Use this option in conjunction with the overlay Draw Filled Items First option to plot color filled contours on top of filled lease outlines but not cover up the leases when the grid color is the same as the background (white).
|
|
For Isopachs, Use WHITE For Values Less Than Zero
|
This option automatically changes the color for values less than zero to be white so that isopachs are not color-contoured below zero
|
|
Automatically Save/Load Contouring Template With Grid
|
This option automatically saves and restores the contouring parameters with the grid file. Whenever the OK button is clicked, a file is saved to the grids folder using the grid file name and an extension of .GDT. Whenever a grid is selected from the grid file list, the template is loaded to restore the settings last used to contour the grid.
|
|
Contour Color Scale Bar
|
These controls set the color scale bar display options:
·ActiveDisplays color bar scale on map
·Always Show All Contour DepthsForces color bar scale to include all depth intervals regardless of scale size.
·Background ColorSelects background color for color bar scale
·PositionSelects which corner of map to place color bar scale.
·Screen Scale Bar Size FactorEnter a factor to change color scale bar size from the default size (1.0)
·Transparent BackgroundSelects if the background of the color scale bar is transparent or not.
|