Z Cross Plot Polygons |
|
Z Crossplot polygons outline different areas of the graph, separating wells that have specific z data relationships. Each polygon in the Z Crossplot Module can have its own name, color, and value. Note that polygon values dont have any effect in the Z Crossplot Module, but exist so that polygons can be shared with the Log Crossplot Module. Polygons allow the user to select wells based a more nuanced criteria rather than by simple data searches, since polygons can vary the cutoff based on the relationship between zone data. The example below shows the Net to Gross crossplot with a single OUTLIER polygon. This polygon covers the data points the net to gross ratio is outside a single standard deviation. Put another way, the amount of net sand in these wells is significantly lower than what the rest of the data would suggest. This could be due to gamma normalization problems or petrophysical effects.
Making a PolygonTo establish a polygon, right click anywhere on the log plot and select Add Polygon. Alternatively, select Polygons>Add from the menu bar at the top of the screen. Drawing a polygon works exactly the same as drawing lines elsewhere in Petra. Pick polygon node points with the left mouse button and select the right mouse button to stop picking points. Petra will automatically close open polygons. During picking, press ESC picking to cancel the current polygon or DELETE to drop the last picked point. Selecting F1 while picking will snap the cursor to the nearest node point on another polygon, which can be useful for generating polygons with no empty space between them and no overlap. Once the polygon is picked, Petra brings up the Polygon Definition box. Here, simply enter the name of the polygon, pick a color, and add a polygon value. The polygon name is a good way of distinguishing the polygons apart when exporting wells, so spending time on descriptive names is a good idea.
Creating a new polygon
The Cross Plot Module with a polygon Modifying and Deleting a PolygonTo change the area of a facies polygon, right click anywhere on the log plot, select Select Polygon, and then left click on the desired polygon. Make sure to click right on the line. Alternatively, select Polygons>Select from the menu bar at the top of the screen, and then left click on the desired polygon. This highlights the polygon and shows its node points; select a node point and drag it to the desired position to change the outline of the polygon. When finished, right click and select Redraw to refresh the screen and show the changes. Changing a polygons name, color, and value is similar. Select the polygon with the mouse, as outlined above. Once the polygon is highlighted, right click and select Modify Polygon. Alternatively, select Polygons>Modify from the menu bar at the top of the screen with the polygon is highlighted. This opens the Polygon Definition box, which sets name, value, and color for the polygon. To delete a drawn polygon, select the polygon with the mouse as outlined above. Once the polygon is highlighted, right click and select Modify Polygon. Alternatively, select Polygons>Modify from the menu bar at the top of the screen with the polygon is highlighted. This opens the Polygon Definition box. Select the Delete Polygon button on the bottom of the box.
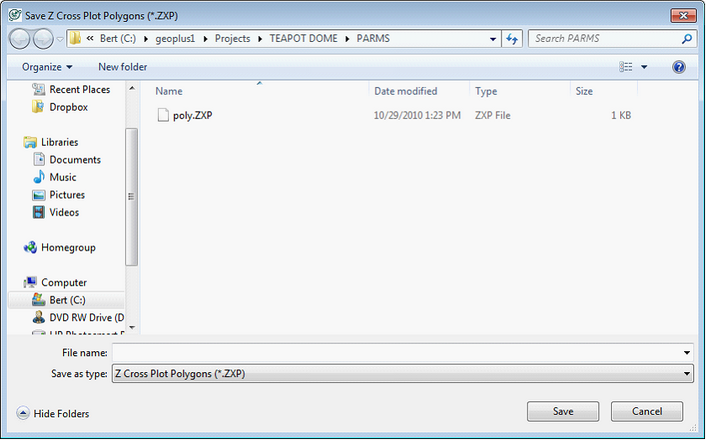
Loading and Saving PolygonsClosing the Log Crossplot Module erases the polygons from Petras memory, so make sure to save the polygons to a file if you want to use them later. Select Polygons>Save from the menu bar at the top of the screen. Create a name and select the save button. On the Save Polygons to Disk box, the area outside the polygons name and value can be modified. By default this area is named DEFAULT and its value is zero. This screen also allows for a comment to better describe the polygons.
Creating a new polygon file (left) and setting the value for data not inside the polygons
On the Save Polygons to Disk box, the area outside the polygons name and value can be modified. By default this area is named DEFAULT and its value is zero. This screen also allows for a comment to better describe the polygons.
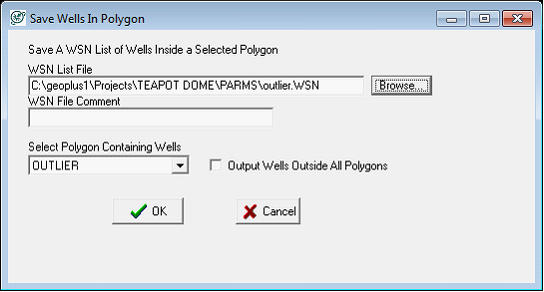
Exporting Wells inside a PolygonTo save a well list select Polygon>Export wells. Here, select the Browse button to navigate to a location on the network and name a WSN list. Next, add a comment for the WSN list if desired. Finally, select the polygon containing the wells to be included in the WSN list. Note that the Output Wells Outside All Polygons only selects the wells not inside any polygon. The example below shows how the wells inside the OUTLIER polygon will be written to a WSN list called outlier.wsn.
|