|
The Cutoff tab controls how a log is shaded relative to a cutoff value. This tab sets the color for the log trace as well as the cutoff shading underneath the log trace.
This tab is enabled when the highlighted log on the Selected Logs list is using the "Shade Using Cutoff" option.
Shade
The shade section sets how the cutoff shading works relative to the cutoff value.
|
Less Than Cutoff
|
Shades the area of the curve wherever the log values are below the cutoff value.
|
|
Greater Than Cutoff
|
Shades the curve wherever the log values are above the cutoff value.
|
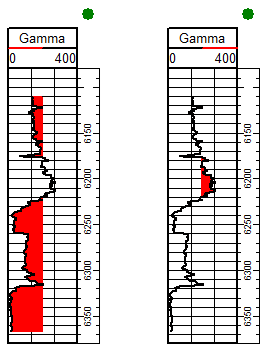
Left = Less than cutoff / Right = Greater than cutoff
|
Cutoff
|
The cutoff section sets the specific cutoff for the selected log curve.
|
|
Constant Cutoff
|
Sets a specific, constant cutoff value.
|
|
Statistical Cutoff
|
Sets a option provides a variable cutoff based on the mean log value and standard deviation. The cutoff value is entered as the number of standard deviations above the mean. The equation used is:
CUTOFF = MEAN + (SD x USERVALUE)
|
|
Curve Line Color
|
Choose the color to use when the log trace is less than the cutoff value. Check the associated color palette to change the color box.
|
|
Shading Color
|
Choose the color to use when the log trace is greater than the cutoff value. Check the associated color palette to change the color box.
|
|
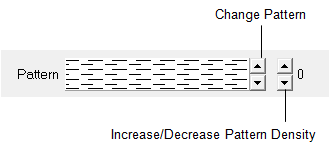
Pattern
|
Petra can draw patterns inside cutoff shading. The left up/down button sets the pattern, while the right up/down button sets the density of the pattern.
|
|
Suppress Curve Outline
|
Hides the outline of the curve. In practice, this option will leave a curve that only shows the fill and pattern.
|
|