|
The log display cross over tab provides additional options on how digital logs are drawn in on the cross section module.
Shade between logs tool
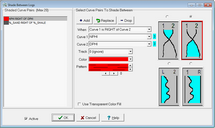
This cross section option allows you to color and pattern fill between two adjacent log traces or a log trace and the track edge.
Only those logs which have been selected for plotting on the "Log Scales" screen will be available for shading between logs.

|
Shaded Curve Pairs List
|
Shows which logs pairs have been selected for shading.
|
|
Select Log Pairs To Shade Between
|
Selects log pairs and shading options. Choose two logs, one from the Log 1 list and the other from the Log 2 list. Set the When option to indicate the relationship of Log 1 to Log 2 when shading should be done. Choose the Color or Pattern to fill with.
|
|
Add
|
Add a new log pair to the selected list
|
|
Replace
|
Used to change the options of an existing log pair
|
|
Drop
|
Removes a log pair from the selection list
|
|
Active
|
- Option check box keeps the shading active
- De-selecting this option disables log shading, but retains the settings
|
For example, you might shade between neutron porosity (NPHI) and density porosity (DPHI) to indicate the presence of hydrocarbon. To do this, first select NPHI as Log1 and DPHI as Log2 then choose the option that says "Log 1 LEFT of Log 2". Shading takes place whenever the NPHI log plots to the left of the DPHI log
|