|
The next step is to set tracks with either the "Set Tracks" button on the guide, or the set tracks button on the toolbar:
 . Tracks simply define where raster logs and the depth track will be drawn in relation to the well symbol and data posting. . Tracks simply define where raster logs and the depth track will be drawn in relation to the well symbol and data posting.
Defining the Log Type
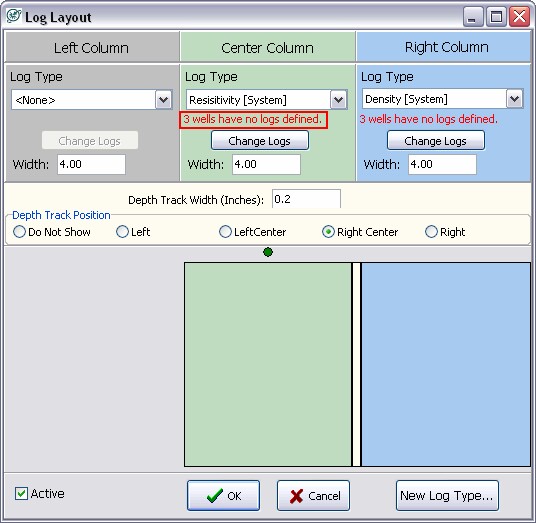
To define a track, click the drop down box directly under "Log Type" for each column. Under this drop down menu, notice that Petra initially creates a few default Log Types including Density, Gamma Ray, Induction, Neutron, Resistivity, and Sonic. In this example, the Resistivity Log Type will be drawn in the center column, and the Density Log Type will be drawn in the right column. You can also select the "New Log Type" button on the lower right corner of this screen to create a new Log Type.
Notice the text underneath each of the columns (highlighted in red below) initially reads "3 wells have no logs defined." Initially, none of the Log Types have any logs names assigned to them. In other words, Petra doesn't know what raster log names (also known as "group names") should be drawn in either the "Resistivity" or "Density" tracks. The next step is to assign log names to each of these Log Types.

Changing the Depth Track Location
You can also modify the location of the depth track. The depth track plots MD or TVD depths next to the raster logs. This option simply moves the location of the depth track relative to the other tracks and the well symbol. In the example below, notice that the depth track is set to "Right Center" between the center and Right column.
Click OK to go to the Log Correlation Tool main screen. Alternatively, click the "Change Logs" button under one of the Log Types to take you directly to the next step at the Assign Log Type screen.
|