|
The Log Correlation Tool also allows you to create and store "unassigned tops." Unassigned tops are useful for correlating things outside the traditional definition of a formation top i.e. distinct, mapable lithostratigraphic units. This can include faults or other marker "picks" that are considered by the interpreter to be unknown, uncorrelated or otherwise "unassigned". Unassigned tops can be easily correlated and converted into formal formation tops.
Just like regular formation tops, you also need to turn on the display of unassigned tops. First, select the "U/A Tops" option under the Step 5, and then click the "Select Tops" button on the guide (highlighted in red).

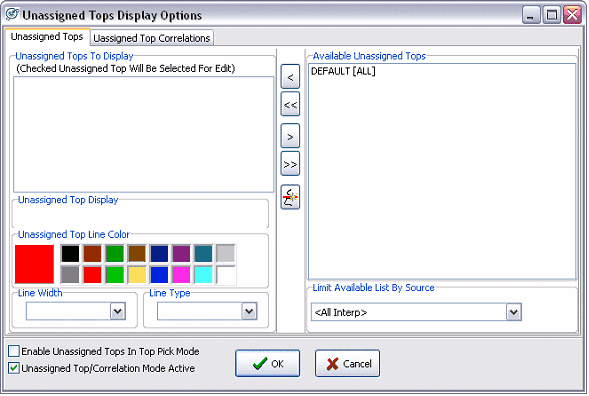
This brings up the Unassigned Tops Display Options Screen. This screen shows all the pre-existing unassigned top names in the project. In the example below, there is only the "default" unassigned tops name. Since this will be shared throughout the whole project, it's a good idea to make a new, named set of unassigned tops. To create a new set of unassigned tops, select the
 button. button.
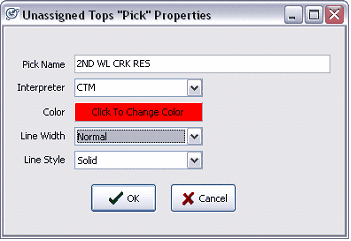
On the Unassigned Tops "Pick" Properties box, enter a name under "Pick Name" that reflects the purpose of your unassigned tops. This can be as generic or as specific as you like. In the example below, the picks are all going to be on 2nd Wall Creek resistivity features, so the pick name is "2nd Wl Crk Res." Next, select or enter an interpreter name. It's a good idea for every interpreter to have their own in order to prevent one user from overwriting another user's work. In the example below, the source name is "CTM." Next, select the line style, width and color for the unassigned tops. Select OK to create the correlation and return to the display options screen.
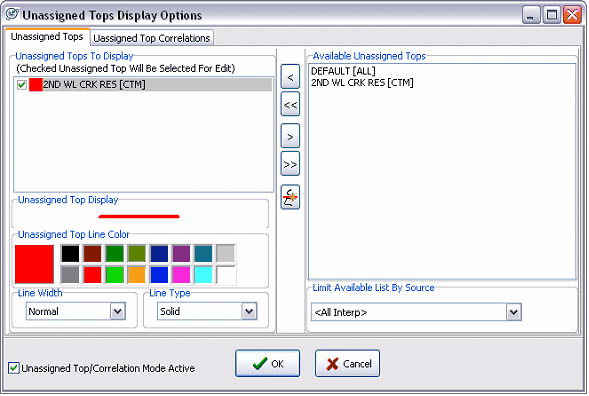
Notice that the unassigned tops name now appears in the Available Unassigned Tops list on the right of the screen. To display a formation top in the Log Correlation Tool, first select it on the Available Tops list and select the "<" button to bring it over into the "Unassigned Tops To Display" list.
Once on this list, you can still change the color of the unassigned tops. Selecting the small check box next to the name on the Unassigned Tops To Display list toggles whether the picks are display only or can be modified. Tops with a green check can be picked and modified in the correlation tool, while those without a green check are display only.
Unassigned Top Correlations Display Options
Unassigned tops by themselves have no relationship to each other. Correlating unassigned tops links them together into a single named unit. These correlations can be flattened to show stratigraphic variation or converted into regular formation tops. One of the best uses for correlation is to flatten the cross section on localized distinctive log features with no formal name.
Just like regular formation tops an unassigned tops, you also need to turn on the display of unassigned top correlations. First, select the "U/A Tops" option under the Step 5, and then click the "Select Tops" button on the guide (highlighted in red).

This brings up the Unassigned Tops Display Options Screen. To look at correlations, click on the "Unassigned Top Correlations" tab on the top of the screen. This screen shows all the pre-existing unassigned top and unassigned top correlations in the project. In the example below, there are no available correlations. To create a new set of unassigned tops, select the  button. button.
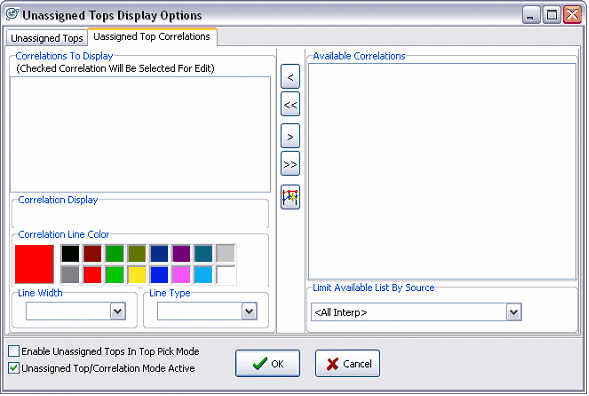
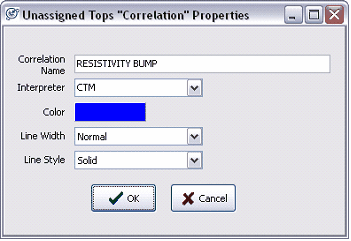
On the Unassigned Tops "Correlations" Properties box, enter a name under "Correlation Name" that reflects the purpose of your unassigned picks. This can be generic or specific as you like in the example below, the correlation is on a single resistivity bump above the 2nd Wall Creek, so the correlation's name is "Resistivity Bump." Next, select or enter an interpreter name. It's a good idea for every interpreter to have their own to prevent one user from overwriting another user's correlations. In the example below, the source name is "CTM." Next, select the line style, width and color for the unassigned top correlation. Select OK to create the correlation and return to the display options screen.
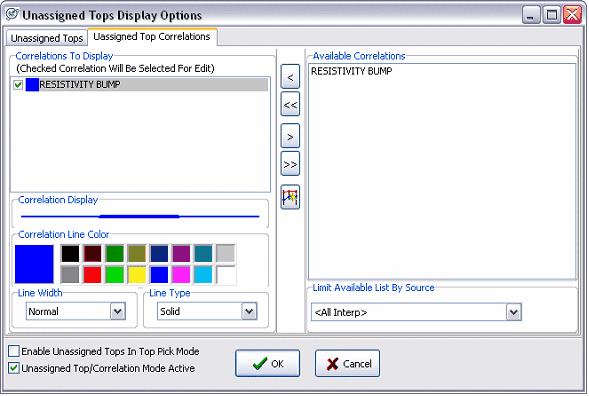
Notice that the correlation now appears in the Available Correlations list on the right side of the screen. To display a correlation in the Log Correlation Tool, first select it on the Available Tops list and click the "<" button to bring it over into the "Unassigned Tops To Display" list.
Clicking the small check box next to the name on the Correlations To Display list toggles whether the correlations are display only or can be modified. Tops with a green check can be picked and modified in the correlation tool, while those without a green check are display only.
Picking Unassigned Picks
To switch to picking unassigned tops, first select the "U/A Tops" option on the Picking type box on the Guide.

This changes the Quick List to show the Unassigned Picks toolbar.

Unassigned Picks

Making Unassigned Tops:
 This creates new unassigned tops under the picks name shown in the dropdown menu. Different pick names can be used to keeps groups of unassigned picks separate by both purpose and interpreter. In the example above, new unassigned tops will be part of the "2nd WL CRK RES" name created earlier. To pick tops, click on the logs on the main screen. Multiple unassigned tops with the same picks name can be added to the same wellbore. Right click to finish picking tops. This creates new unassigned tops under the picks name shown in the dropdown menu. Different pick names can be used to keeps groups of unassigned picks separate by both purpose and interpreter. In the example above, new unassigned tops will be part of the "2nd WL CRK RES" name created earlier. To pick tops, click on the logs on the main screen. Multiple unassigned tops with the same picks name can be added to the same wellbore. Right click to finish picking tops.
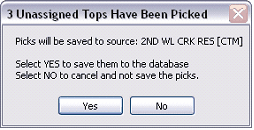
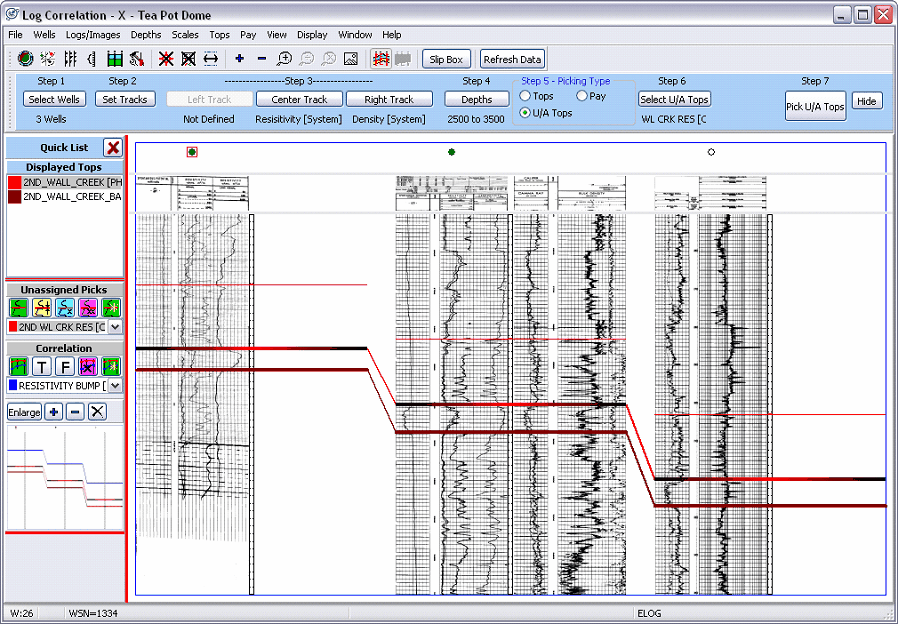
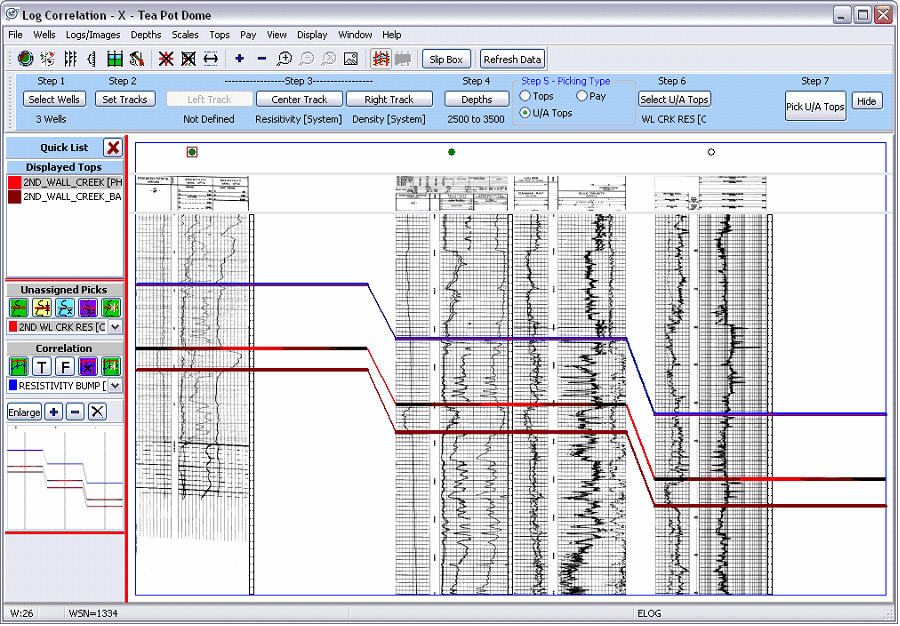
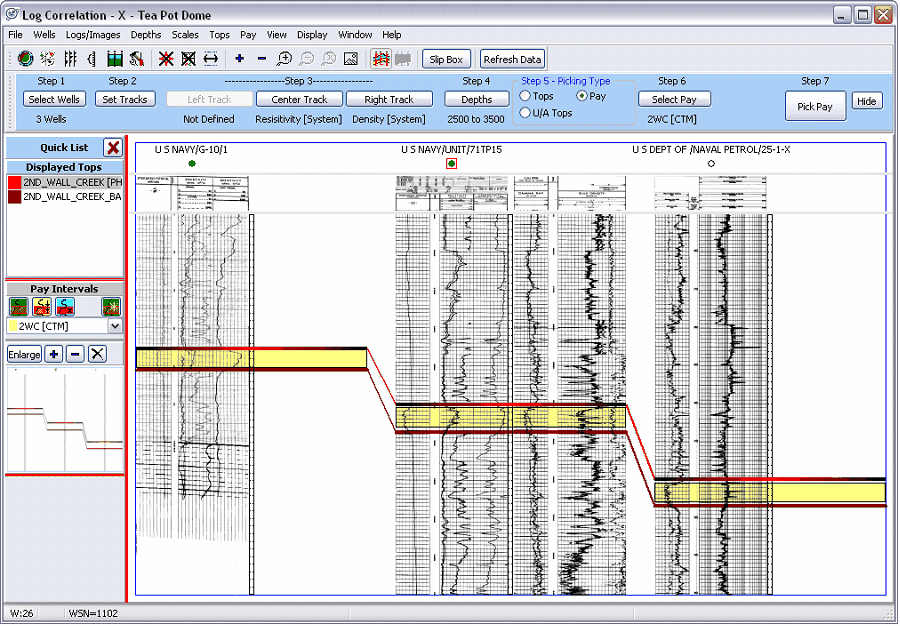
This brings up the option of saving the new pay intervals to Petra's database. Selecting "No" will erase all new, unsaved unassigned picks. In the example below, notice the red lines signifying the resistivity anomaly picked as a unassigned top.
Moving Unassigned Tops:
 To move unassigned tops, select this button. Left click the unassigned top to move and drag it to the new location. When finished, right click the mouse button. This brings up the option of saving the new pay intervals to Petra's database. Selecting "No" will leave all unsaved pay picks unchanged. To move unassigned tops, select this button. Left click the unassigned top to move and drag it to the new location. When finished, right click the mouse button. This brings up the option of saving the new pay intervals to Petra's database. Selecting "No" will leave all unsaved pay picks unchanged.
Delete Selected Tops:  To delete unassigned tops, select this button. Left click the unassigned top to delete it. The unassigned top interval will be hatched with red to show that the changes haven't been saved to the database. When finished, right click the mouse button. This brings up the option of deleting the unassigned top from Petra's database. Selecting "No" will leave all unsaved pay picks unchanged. To delete unassigned tops, select this button. Left click the unassigned top to delete it. The unassigned top interval will be hatched with red to show that the changes haven't been saved to the database. When finished, right click the mouse button. This brings up the option of deleting the unassigned top from Petra's database. Selecting "No" will leave all unsaved pay picks unchanged.
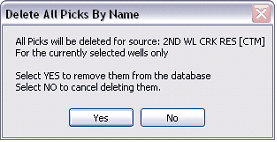
Delete Tops by Name:  This button deletes all the unassigned tops with the currently selected unassigned tops name. In this example, the "2nd Wl Crk Res" unassigned tops group is selected, so selecting this option will delete all the "2nd Wl Crk Res" unassigned tops on the currently selected wells. This button deletes all the unassigned tops with the currently selected unassigned tops name. In this example, the "2nd Wl Crk Res" unassigned tops group is selected, so selecting this option will delete all the "2nd Wl Crk Res" unassigned tops on the currently selected wells.
Create New Unassigned Tops Name: This button provides another quick way to create new unassigned group names. This brings up the New Pay Interval Definition screen. Enter the name, source, description, and color of your pay zone. Unassigned top names created here will automatically show up in the Unassigned Picks dropdown menu on the Quick List. This button provides another quick way to create new unassigned group names. This brings up the New Pay Interval Definition screen. Enter the name, source, description, and color of your pay zone. Unassigned top names created here will automatically show up in the Unassigned Picks dropdown menu on the Quick List.
Unassigned Correlations

Connect Unassigned Tops:
 This button designates selected unassigned tops to a specific correlation. First, select the correct correlation name on the lower dropdown menu (in the example above, the correlation is called "Resistivity Bump"). Next, select the "Connect Unassigned Tops" button and click on unassigned tops on the wells to add them to the correlation. Right click when done. The unassigned tops will now be connected by a line to signify that they are part of a correlation. In the example below, the blue correlation line connects the unassigned tops. This button designates selected unassigned tops to a specific correlation. First, select the correct correlation name on the lower dropdown menu (in the example above, the correlation is called "Resistivity Bump"). Next, select the "Connect Unassigned Tops" button and click on unassigned tops on the wells to add them to the correlation. Right click when done. The unassigned tops will now be connected by a line to signify that they are part of a correlation. In the example below, the blue correlation line connects the unassigned tops.
Convert Correlation to Fm Top:
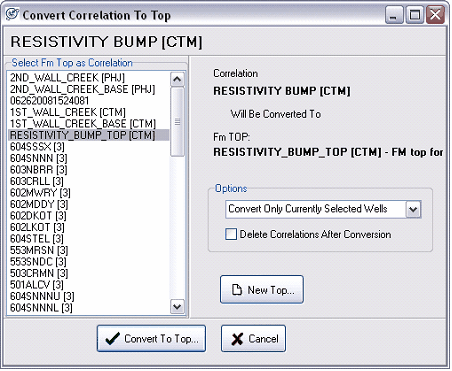
 This button converts a correlation into a fm top. As a formal fm top, the surface can be gridded or used in calculations. First select the appropriate correlation from the correlation dropdown menu. Next, select the "Convert correlation to Fm Top" button to bring up the "Convert Correlation To Top" window. This button converts a correlation into a fm top. As a formal fm top, the surface can be gridded or used in calculations. First select the appropriate correlation from the correlation dropdown menu. Next, select the "Convert correlation to Fm Top" button to bring up the "Convert Correlation To Top" window.
This brings up the Convert Correlation To Top window. Here, select an existing fm top or create a new top for the correlation. In this example, the "Resistivity Bump" correlation will be converted to the "Resistivity Bump Top" Fm top. This newly created fm top will be stored into Petra's database.
This screen also gives you the option to convert the correlation for all wells in the database, only the currently selected wells in the Log Correlation Tool, or only the wells selected in the Main Module.
Flatten on Correlation:
 This option flattens all wells onto the correlation selected on the correlations dropdown menu. This is useful for quickly seeing changes in stratigraphy or for testing correlations without the formality of a true fm top. This option flattens all wells onto the correlation selected on the correlations dropdown menu. This is useful for quickly seeing changes in stratigraphy or for testing correlations without the formality of a true fm top.
Delete Correlation:
 This option deletes the correlation selected in the correlation dropdown menu. This option deletes the correlation selected in the correlation dropdown menu.
Create new unassigned top name:
 This option is another way to quickly create a new correlation. Select this button, and enter the name, interpreter, color, and line width and style of the correlation line. Correlations created here will automatically be displayed. This option is another way to quickly create a new correlation. Select this button, and enter the name, interpreter, color, and line width and style of the correlation line. Correlations created here will automatically be displayed.
Making another Cross-Section.
After you pick your first set of tops and pay, it's not necessary to go through the entire process again for a new cross-section. Petra saves track settings, default logs, depths, and top information to apply to your next set of wells. To make a new cross section, all you'll have to do is select the new set of wells (Step 1) and make adjustments in the default and/or assigned raster logs (Step 3). Continually making small improvements to your default Log Type list as you make new cross sections is a good use of your time the better and more comprehensive your default Log Type list, the less time you have to spend individually assigning raster logs to wells.
Other Display Options
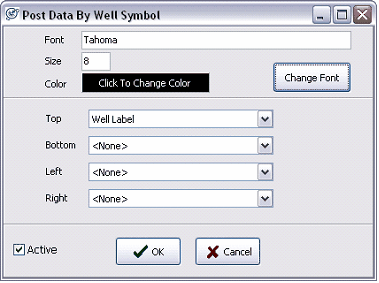
Plotting Well Data around Well Symbol To plot well data around the well symbol at the top of the screen, select Wells>Plot Data around Well Symbol. This brings up the Post Data By Well Symbol screen. Here you can select which well identification data will be plotted around the well symbol. In the example below, the wells' label is plotted above the well symbol.
Well Symbols - While in the Correlation Tool's main screen, dragging the lower line of the frame containing the well symbols increases and decreases this space. The
 and and
 buttons on the toolbar at the top of the screen toggle the well symbol and well data on and off, respectively. buttons on the toolbar at the top of the screen toggle the well symbol and well data on and off, respectively.
The example below shows well labels displayed over each well symbol.
Plotting Log Scale Information The tops of raster images usually have scale information for each track. If this scale information is calibrated, it can be shown on the Log Correlation Tool's main screen. To show and hide this raster scale information, click the
 and and
 buttons on the toolbar at the top of the screen. The next step is to tell Petra how the scale information is stored in the raster calibration. Under Logs/Images>Log Header Display on the menu bar at the top of the screen, select "Header", "Lower Scale", or "Upper Scale." Many older Petra projects store scale information as the "header." Once this data is displayed, dragging the lower line of the frame containing the scales stretches and squeezes the image scales for readability. buttons on the toolbar at the top of the screen. The next step is to tell Petra how the scale information is stored in the raster calibration. Under Logs/Images>Log Header Display on the menu bar at the top of the screen, select "Header", "Lower Scale", or "Upper Scale." Many older Petra projects store scale information as the "header." Once this data is displayed, dragging the lower line of the frame containing the scales stretches and squeezes the image scales for readability.
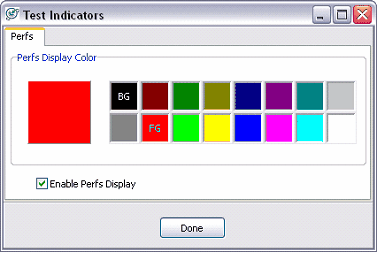
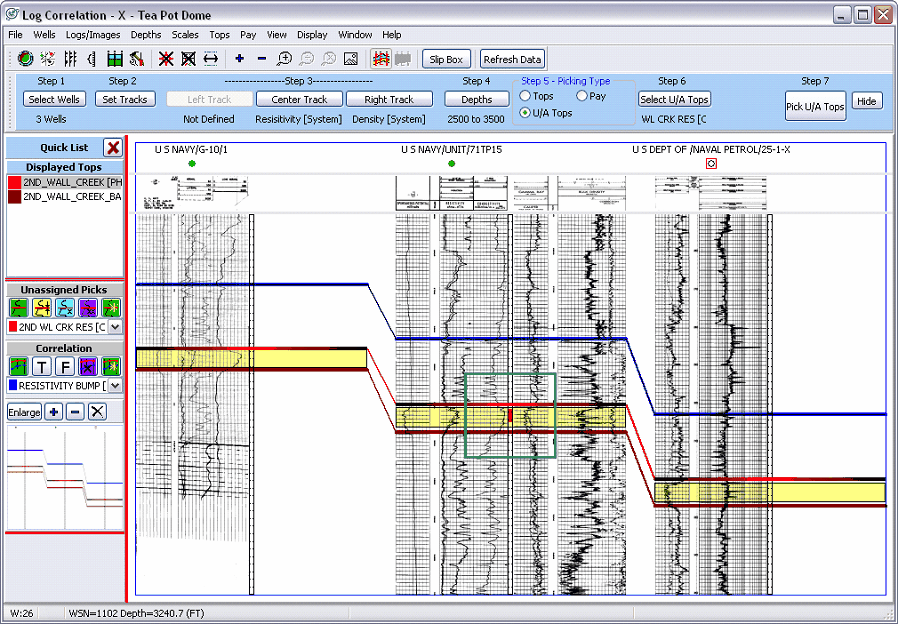
Test Indicators - Select Wells>Plot Test Indicators to bring up the Test Indicators screen. Select the display color for perfs, and click "Enable Perfs Display." The Log Correlation Tool will display perfs as a colored box on the depth track. The example below shows perf indicators as a red rectangle on the depth track (highlighted in green).
Zoom and Scroll
For detail work, it's probably advantageous to zoom and scroll on the cross section. There are two ways to zoom in and out on the Log Correlation cross section.
Toolbar Zoom The toolbar has a set of zooming tools:
 . .
"+" and "-" zoom in and out by 1/2 onto the center of the screen. The
 button allows you draw an area to zoom. The button allows you draw an area to zoom. The
 button returns to the last zoom setting, while the button returns to the last zoom setting, while the
 magnifying glass removes all zoom to return you to the default scaling. magnifying glass removes all zoom to return you to the default scaling.
The Pan and Scroll Window - This window on the Quick List log correlation window pans and scrolls around a zoomed cross-section. The "enlarge button" creates an additional window, which is useful for double monitor setups.
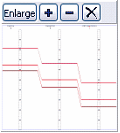
Like the toolbar zoom, the "+" and "-" zoom in and out of the center of the screen, while the "X" removes all zoom. The extents of the log correlation main window are shown in red on this window. Dragging this red outline scrolls the extents of the main correlation window at the current zoom level.
Scrolling with the Arrow Keys Window When zoomed in on a section, you can also quickly pan across the section using the arrow keys. By default, the screen will pan by 50% with every key press. To change this number, go to Display>Arrow Keys.
The Right Mouse Button
Many common commands and some context-specific commands are available by clicking the right mouse button on the cross section. A familiarity with these commands can ultimately add up to huge savings in time and effort.
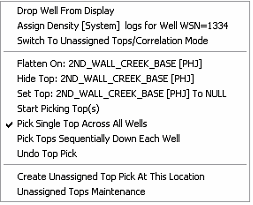
The right mouse button accesses several common commands related to tops. Place your mouse over the top right click the mouse flatten on, hide, or null the closest picked fm top. To start picking the selected top under the Pick Tops Quick List, right click and select "Start Picking Top(s)."
.
Slip Box
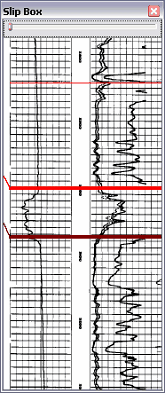
The slip box takes a screenshot of a part of the cross-section and places it into a separate window inside the cross-section. This section of the log can be a great help to correlation between one log and another. The slip box window can be moved around the screen, as well as stretched and squeezed. The slider box on the top of the window changes the box's opacity to make it easier to overlay on top of other logs.
|