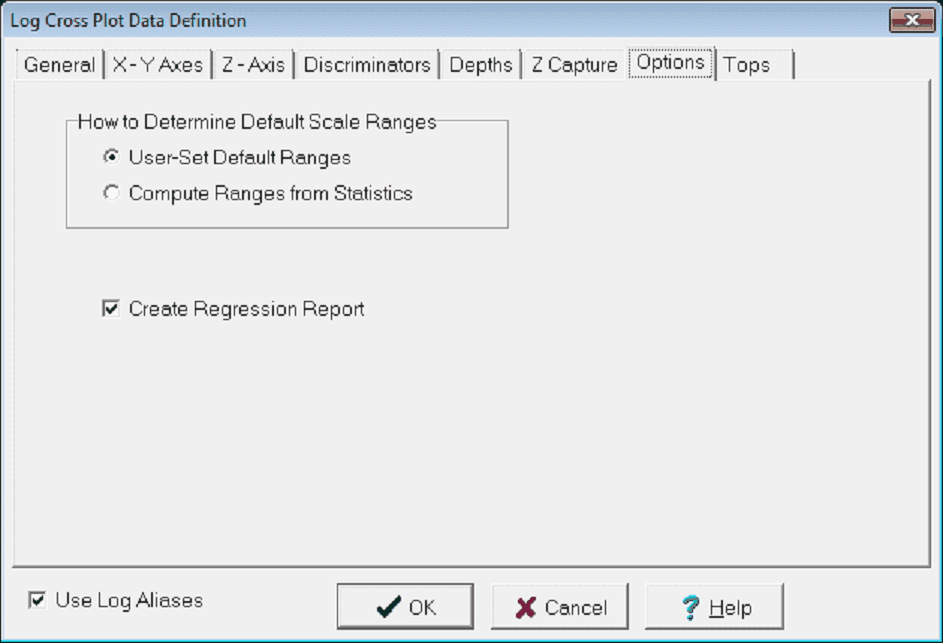
Log Crossplot Data Options tab |
|
The Options tabs sets a couple of additional options for the Cross Plot Module.
How to Determine Default Scale RangesThis option simply governs how Petra populates the scale ranges on the X-Y Axes tab and Ternary tab when a curve is added for the first time. By default, Petra uses the user-set default ranges established in the Main Modules Logs tab. Alternatively, Petra can conduct a statistical measurement of the curves. Create Regression ReportThis option creates a regression report called xplot_regression.txt in the projects PARMS directory. This report contains statistical measurements of the relationship between the X and Y axes, as well as a regression linear equation. While inside the Log Crossplot Module, select CTRL + R to quickly open this report.
REGRESSION REPORT Jul 1, 2010 10:10 AM
X = GR Y = ILD
LINEAR REGRESSION N = 266 SUM X = 27227.29900 SUM Y = 27227.29900 SUM X^2 = 3078851.23372 SUM Y^2 = 171.41121 ssx = 291912.09524 ssy = 20.44893 r1 = -2082.67644 r2 = 5969289.15957 Corr Coef = -0.85243 Slope = -0.00837 Y-Int = 1.61005 Std Error = 0.15120 Equation: LOG(ILD) = (-0.00836969)*GR + 1.6101 |
