Log Crossplot Data Tops tab |
|
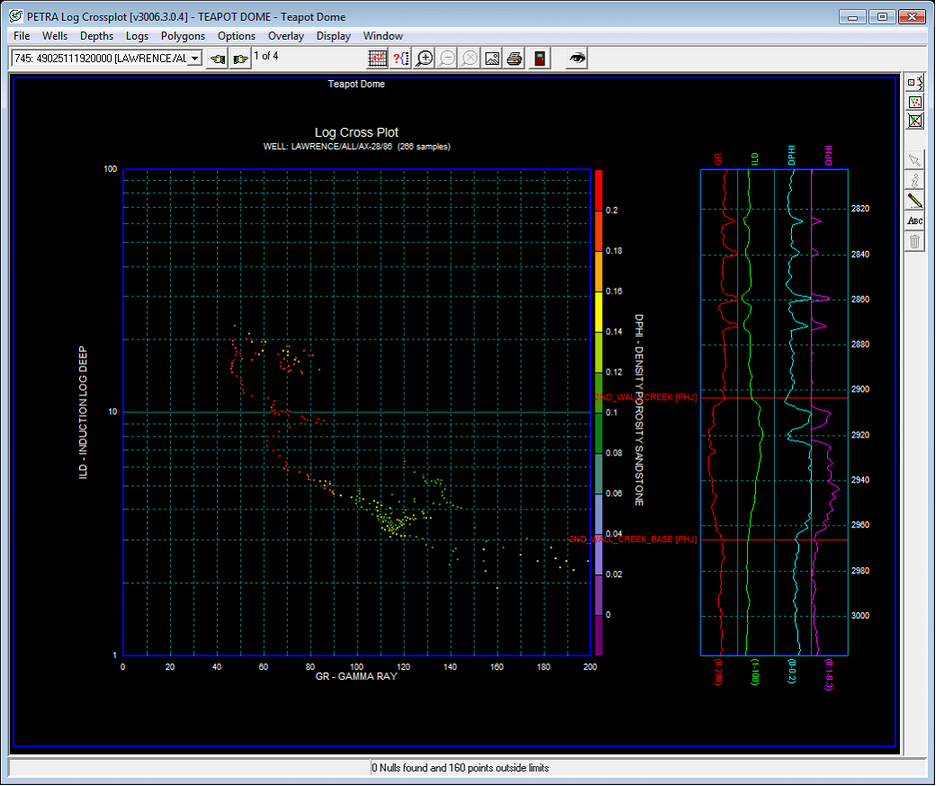
The Tops tab sets the display of tops against the curves displayed on the right side of the screen.
Display Tops on Logs - This option simply toggles the selected tops. When toggled on, the curve vs depth plot on the right will display the selected tops. When toggled off, Petra leaves off the tops, but retains all the tops and color settings. Available and Selected TopsTo add a top highlight the desired top name in the "Available Tops" list and click the add button (">"). This moves the log over to the Selected Tops list. To remove a top, highlight the top name in the Selected Tops list and click the remove button ("<"). The >> and << buttons add all tops and remove all tops, respectively. StyleTo change the color of a top, select the top on the Selected Tops list and select the desired color using the color box on the right. The All button applies the selected color to all tops on the Selected Tops list. In the example below, the 2ND_WALL_CREEK top and the 2ND_WALL_CREEK_BASE tops are both displayed in red.
|