Map Monthly Production Chart Options tab |
|
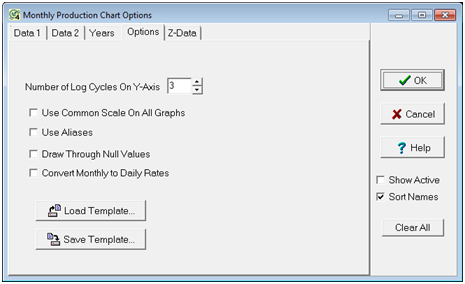
The Options tab sets some of the details and scaling for the monthly production charts.
Number of Log Cycles on the Y-Axis - This entry sets the number of logarithmic decades. Use Common Scale On All Graphs - This option forces all 3 graphs to use the maximum computed scale. Use Aliases - This option uses monthly production name aliases. Draw Through Null Values - This option will draw a line to connect all values. By default, months with no production have gaps in the graph line. Position Relative to Well Symbol - This option sets the location of the monthly production plot around the well symbol.
Load Template - This button loads previously saved production options settings from a *PDO file. Save Template - This button saves the production options settings to a *PDO file. |