Map Monthly Production Chart Years tab |
|
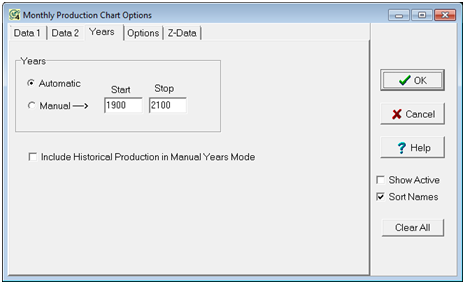
The Years tab sets the extents of the X axis Automatic - This option sets automatic scaling for the X axis of the production chart to the first and last month of production. Manual - These entries set limits on the duration of production data. By default, Petra displays data from 1900 through 2100, which will be much too big a range for most applications. Include Historical Production in Manual Mode - Some states record historical production in a single historical year labeled "0." This option includes this historical year 0 in when years are set manually. |