Background
In the right figure below, theres a flat, 2-D picture of the spherical, 3-D Earth. This figure is, in effect, a crude map projection. The center of the image on the right is on the equator and 100° W. The lines of longitude at 90° W, 100° W and 110°W are outlined.
On the right side of the figure, weve stripped out the picture of the globe to leave the three longitude lines where one is straight, and two are curved. Since each one of these lines represents a line of longitude, all three of these lines are straight north and south. The curvature is the consequence of projecting the curved surface of the earth onto a flat surface. The straight line in the center is the central meridian. The central meridian defines the center of the projection and consequently has the least distortion. Away from the central meridian, however, the distortion increases and longitude lines start to curve - especially at higher latitudes.
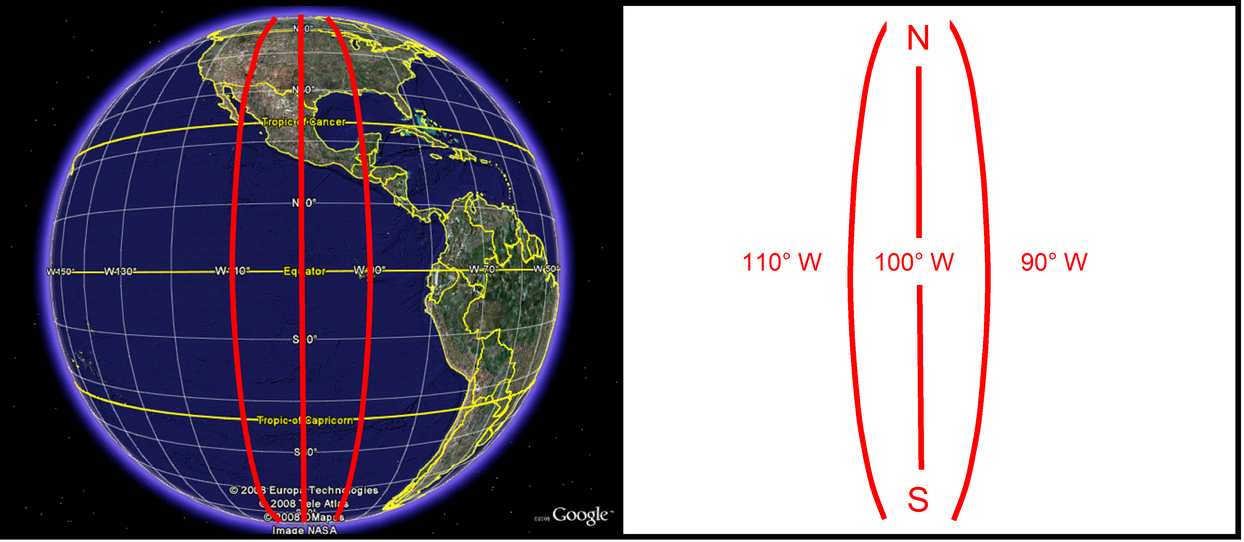
A globe (modified from Google Earth, 2008) highlighting 110, 100, and 90 degrees longitude (Left), the same longitude lines without the globe (Right). Modified form Dana (1999)
True north is at the top of the map, but away from the central meridian the local direction of north known as grid north will be just a little different. To better illustrate the difference, there are two sets of arrows on the figure one to the west in Utah and one to the east in Missouri. The longer arrows on the figure show true north at the top of the map, while the shorter arrows following the curved longitude lines reflect the local grid north. The difference between these two directions is called the convergence angle, and is shown on the figure to the right. Odds are good youve actually already run into this before angled section lines (common in west Texas and New Mexico) follow grid north rather than true north.
Looking closely at the Carter-Knox map shows that these section lines are angled slightly as well. The difference between true north and grid north for this area with the UTM Zone 14 projection is around 0.8 degrees.

Carter Knox Field with the same longitude lines highlighted (Left), a diagram of true north vs. grid north (Right)
Directional data need to be projected to your maps grid north rather than true north in order to plot on the map correctly. To better illustrate the point, a directional well going due north should be parallel to the north-south section lines even if the section lines are angled like in the Carter Knox project.
The problem is that theres no consistent standard for reported directional survey convergence angle correction. While most companies report survey data relative to a projection-dependant grid north, many directional companies report survey data relative to true north. Failing to add a convergence angle to true north-based data or adding a convergence angle correction to grid north-based data will both result in a wellpath thats plotted in the wrong place.
Turning off all Convergence Correction
The simplest way to turn off all convergence correction is to select the Survey Convergence Angle button on the second toolbar on the Map Module. To open and close this toolbar, select the << button on the far right side of the regular toolbar

Turning off all convergence angle correction (currently active)

Turning on all convergence angle button (currently inactive)
This is a relatively quick way of turning off all convergence angle correction without changing individual well flags.
Setting the Convergence Correction Flag for a Single Well
Odds are good, however, that the directional wells in any given project will be a mix of grid and true north-based surveys. In order to correctly draw every well, Petra stores a flag for each well. To change this convergence correction flag for a single well, first select the correct well in the Main Module. Next, open the Directional Survey Data by going to the Location tab and select the Dir. Survey button. Finally, navigate to the Advanced tab on the Directional Survey Data box and select XY Grid North (Never Rotate for Map Projection) under the Survey data Orientation section.
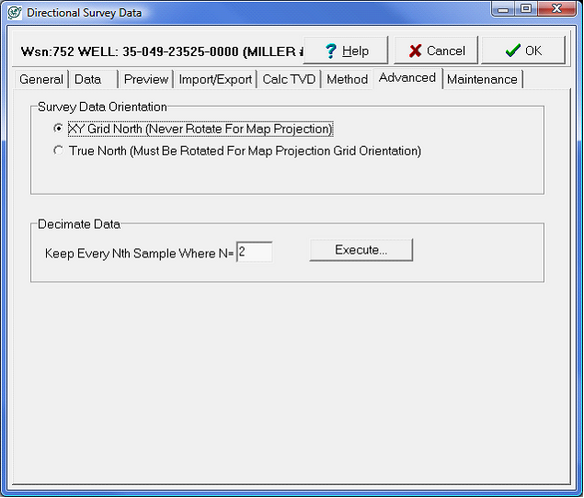
Setting the convergence correction for a single well
Setting the Convergence Correction Flags for All Directional Wells
To change the convergence correction flags for all wells, select Compute > from Locations > Set Dev. Survey Grid Orientation from the Main Module. Here, you can select to disable or enable the convergence correction for all wells with the bottom two options: Set All Flags to GRID NORTH or Set All Flags to TRUE NORTH.
Reviewing convergence correction for all directional wells
Petras Analyze Survey tool can shed light on whether a convergence angle should or should not be applied to a particular well. Essentially, Petra calculates a BH location for the survey data both with and without a convergence correction. These two BH locations can then be compared with the actual header-supplied BH location. Based on this comparison, Petra can recommend whether an individual well should or should not have a convergence correction. The example below shows a report generated from the first option, Analyze Survey and Report Only.
The results of a Petra review of BHL locations and convergence corrections
In the example above, most surveys show that the true north BH is closer to the actual BH, so the convergence correction is set correctly. The highlighted well, however, shows that the current convergence correction is set to grid north, while the true north setting is closer. Petra can either make just a report or change the convergence flags for each well automatically.
|