|
This feature analyzes line data from an overlay layer and generates rose diagrams illustrating orientation and coverage of the lineament features on a regional basis.

Lineament Analysis on the Map Module
Region Grid Cells
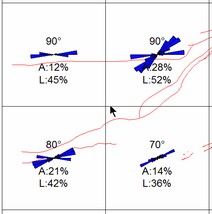
Lineament or fracture data in an overlay layer is subdivided into a series of regional grid cells. The outlines of the grids can be seen in Figure 1. The total length of lines within each cell is summed and a histogram is built based on the orientation of each line segment. Only the portion of a line lying within a cell is considered in these calculations.
Area Coverage Values
Each regional grid cells is, in turn, subdivided into a series of 10x10 grid cells. This sub-grid is used to determine the percent of area coverage by lineaments of fractures. If a line crosses a subgrid cell, then the area of the subcell, or 1% of the regional grid cell, is summed as "area coverage" value and can be posted. These values are indicated as A:nnn.
Length Values
Values can be posted that provide a relative length of lines in a regional grid cell. These values are computed as follows. The total length of all lines inside a regional cell are totaled. Then, the maximum of these lengths is found. The "length value" for a cell is the percent of the cell's length to the maximum length. These values are indicated as L:nnn.
Dominant Angle Values
The dominant angle of orientation for each regional grid cell can be posted above the rose diagram. The dominant angle is the "mode" of the histogram, i.e., the orientation that has the longest line segments.
General tab

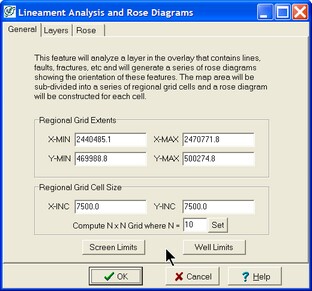
The regional grid is defined as a rectangular box in XY map units. The cell size of increment also defined in XY map units. If you wish to have the region divided into a 10 rows by 10 columns, simply enter 10 in the "NxN" field and click the "Set" button. The appropriate x and y increment will be computed.
There are two button to set the grid extents to the current screen limits or the limits defined by the well data on the map.
Layers tab

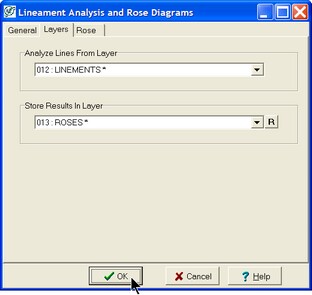
Analyze Lines From Layer - This dropdown sets the overlay layer containing all lines, fractures, lineaments, etc. used to compute the rose diagrams.
Store Results In Layer - This dropdown contains the layer name of the layer receiving the rose diagrams, text and other graphics. Petra will completely replace the contents of this layer before storing new data. This layer can not be in a read-only mode. The "R" button renames the output layer.
Rose tab
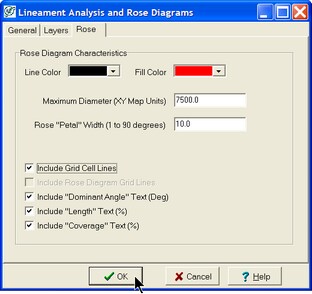
The Rose tab sets a few additional details on how the rose diagram plots.

Line Color - This option sets the overlay color for the rose diagrams' outline.
Fill Color - This option sets the overlay color for the rose diagrams' interior fill.
Maximum Diameter (XY Map Units) - This option sets the size of the largest rose diagram. It's best to set this values no larger than the grid cell size.
Rose "Petal" Width (1 to 90 Degrees) - This option sets the the angle increment used when building orientation histograms.
Include Grid Cell Lines - This option plots the regional grid outlines on the Map Module.
Include "Dominant Angle" Text (Deg) - This option plots the lineaments' dominant angle above each rose diagram.
Include "Length" Text (%) - This option posts the relative length of lines within each cell.
Include "Coverage" Text (%) - This option posts the area covered by fractures in each cell.
|