Map: Options > Bubble Map
Bubble maps display data items as color-filled circles or circle segments at each well. The bubble can change color or size with the data's value. Multi-bubble segments can be equal or proportional to the percentage of the total similar to a pie chart. Bubble maps are ideal for illustrating highly variable data sets such as cumulative production.
To add a bubble map:
- Select the
 button on the Map Module toolbar button on the Map Module toolbar
- Map: Options > Bubble Map
Title - This title appears in the legend for the bubble map
Bubble Mode
Normal Bubble Mode - Normal bubble mode produces a single or multi-segmented bubbles of equal proportions. The radius can be fixed or vary with the z value magnitude.
Pie Bubble Mode - This option produces a "pie chart" for multiple z values where each segment size is proportional to the percentage of the total. The radius can be fixed or vary with the magnitude of the sum of all z values.
Discrete Bubble Mode - This option can specify up to 12 discrete ranges so that all values with a given range will have the same bubble size.
Data Items for Bubbles (max 32)
The list box on the left of the screen shows each z data item selected for bubble map display. Z data items are chosen from the ZDATA TAB and added to the list box using the  button. List box Items can be replaced using the button. List box Items can be replaced using the  button or dropped using the button or dropped using the  button. button.
Z Data tab
This section displays two drop down lists. The upper list contains all data groups and user-defined zones. Selecting an item from this list causes the lower list to display all z-data items associated with the zone. Selecting a z-data item causes the "Value Range" to display a suggested data range based on the z-data statistics.
Select Z Data Used For Bubbles
Stats... - This button displays a histogram of the selected z-data item.
View Z Data - This button opens a zone data item viewer. Here, use the "+" button to the left of the desired zone to expand the tree, and then select the desired data item. Note that entries here can be edited as well.
The View/Edit Zone Data tool with no data item selected (left) and with a data item selected (right)
Use Aliases - This option enables zone aliases.
Disabled - This option disables the data item on the Data Items For Bubbles list. This is functionally the same as double clicking the item on the Data Items For Bubbles list. Disabled items will have a  next to it. next to it.
Value Range
Default Value Range - This tool computes the range for the selected data item. Specifically, this tool sets the range +/- 2 standard deviations around the mean.
Colors - This tool opens the Color Interval Definition tool to set the color and interval boundaries over the selected z-data value range.
Radius tab (Normal Bubble Mode)
Selecting the "Normal Bubble Mode" will enable the Radius tab. The Radius tab sets how the size of the bubbles.
Constant Radius - This option draws all bubbles at the same size, regardless of the value of the data item. The entry box and dropdown sets the desired units - note that the size of the bubble can be set in map inches, XY map units, and acres.
Vary Radius as Units/Inch - This option draws bubbles that vary with the values of the data item; wells with large values will have large bubbles. This entry varies the radius as units/inch.
Scale Maximum Z Value to XY Map Units - This option sets the maximum radius of all bubbles to a specified distance in XY map units (feet or meters). Since these options are in XY units, all bubbles remain at a relative size independent to the map scale. Bubbles will be limited in size to the maximum radius size in inches. No bubble will exceed the maximum radius size.
Scale _____ to XY Map Units - This entry sets the radius in XY units, divided by a scale factor. For example, a value of 200 and a scale entry of 2 will draw a bubble with a 100 XY unit radius.
Values are XY Units (Apply Map Scale) - This option sets the size of the bubble as directly proportional to the XY map units. For example, a value of 200 will draw a bubble witha 200 XY unit radius.
Limit Radius to - This entry sets the maximum radius of the bubble selected on the "Data Items For Bubbles" list. Note that this can be set in inches or XY units.
Pie tab (Pie Bubble Mode)
The Pie tab sets z value scaling information and sets the radius style for all pie bubbles. Each z value can be scaled using a multiplication factor. This allows z values or differing units to be combined without one overwhelming the others.
Multiply Data item By - This option multiplies the data item by a constant. This can be useful for increasing the size of one data item in the pie relative to other data items.
Pie Scaling
Constant Radius in Inches - This option draws all pie bubbles with the same radius. Only the proportion of the pie slices will change. This entry sets the radius in inches.
Vary Radius as Units/Inch - This entry sets the radius in inches, divided by a scale factor. For example, a value of 200 and an entry of 200 will draw a bubble with a 1 inch radius.
Scale Max Z To - This entry sets the radius in XY units, divided by a scale factor. For example, a value of 2000 and an entry of 20 will draw a bubble with a 100 XY unit radius.
Limit Radius To - This option sets the maximum size of the pie. Pie bubbles will not be larger than this setting, regardless of the value. Note that this option is set in either inches or XY units immediately to the right.
Min Radius - This option sets the minimum size of the pie. Pie bubbles will not be smaller than this setting. Note that this option is set in either inches or XY units immediately to the right.
Pie Normalization
This option determines how the size of each pie bubble is computed.
Normalize to the SUM of all Items - This option sets the relative size of each slice in a proportion to the sum of all the data items displayed on the bubble map. This option is useful for displaying multiple equal variables, such as the relative proportion of production out of two or more intervals.
Normalize to the First Item Listed - This option sets the relative size of each slice in proportion to the value of the first data item displayed on the bubble map. This option is userful for displaying data relative to a single variable. As an example, this can be useful for plotting RR vs EUR production values, where the "EUR" would be the first item on the "Data Items For Bubbles" list.
Discrete tab (Discrete Bubble Mode)
This screen allows you to set the low bound, high bound, radius and color for up to 12 discrete bubble sizes. When a bound cell is left blank, the associated range value is set to 1E30. If the radius is blank, the line is ignored during display.
Options tab
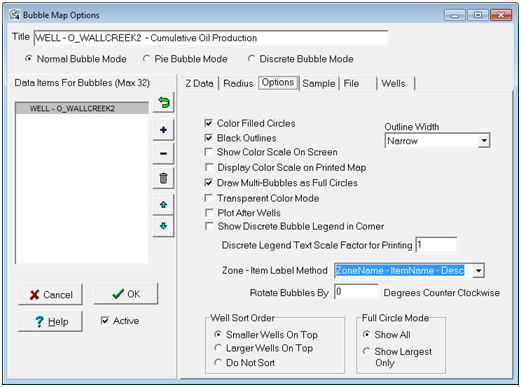
Color Filled Circles - This option fills the bubble maps with the colors specified on the Z Data tab. Deselecting this option will only draw outlines of the bubbles.
Black Outlines - This option draws a black outline around the bubbles. Disabling this option will draw open colored circles. Check the Black Outlines to have the color filled circles outlined using a black pen.
Show Color Scale On Screen - This option displays a color bar scale in the upper left corner of the map.
Display Color Scale on Printed Map - This option adds a color bar on the printed map, rather than the map on the computer screen.
Draw Multi-Bubbles as Full Circles - This option will draw bubbles as variable radius concentric circles instead of wedges.
Transparent Color Mode - By default, Petra draws bubble maps with an opaque color, and the bubble can cover other elements. This option instead draws the line or polygon with a transparent color. With a transparent drawing mode, other elements will be visible through the line or polygon.
Plot After Wells - By default, Petra draws well symbols after and on top of bubbles. This option instead draws the bubbles after the well symbols, so that the bubbles are on top.
Show Discrete Bubble Legend in Corner - This option adds a legend for the discrete radii and bounds set on the Discrete tab in the upper left corner of the Map Module.
The Discrete Bubble Legend
Well Sort Order
The Data Sort Order section includes options for sorting the bubbles by Z value. Sorting in "Ascending" order results in smaller bubbles plotting on top of larger bubbles. Sorting in "Descending" order puts larger bubbles on top of smaller bubbles. The "Do Not Sort" option results in bubbles plotting in well sequence order.
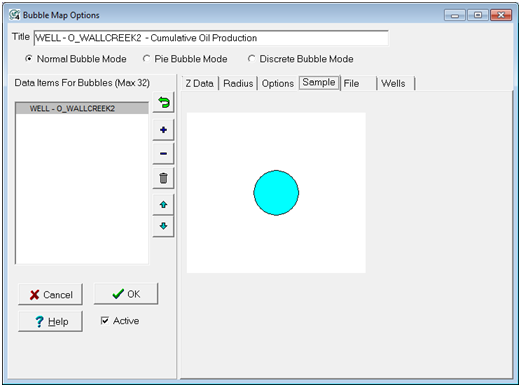
Sample tab
This tab shows a sample of the bubble map circle. When multiple z data items are displayed, the currently selected list box item is identified in the multi-segmented bubble as a highlighted color.
File tab
The File tab saves and loads bubble map settings to an external file. This can be useful for rapidly switching between several bubble map settings.
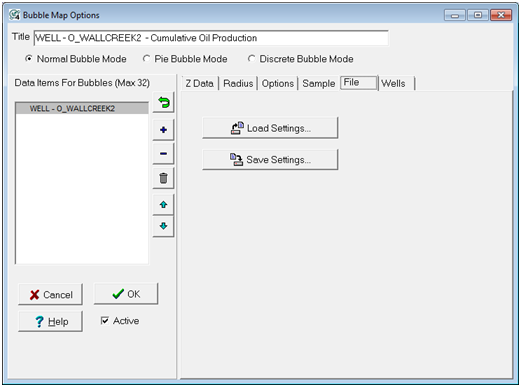
Load Settings - This option replaces the current bubble map settings with those from an external file.
Save Settings - This button saves the current bubble map settings to an external *.BUB file.
Well tab
The Well tab can limit the bubbles displayed on the Map Module to only the wells listed on a WSN list.
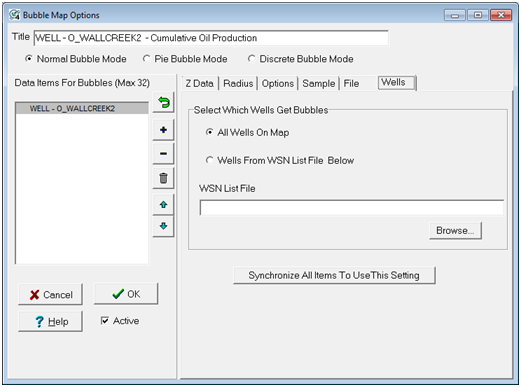
All Wells On Map - This option does not limit the bubbles, and displays bubbles for every well on the Map Module.
Wells From WSN List File Below - This option limits the bubbles to only the wells listed on the WSN list selected below.
WSN List File - This entry sets the location of the WSN file.
Synchronize All Items To Use This Setting - This option sets all data items on the "Data Items For Bubbles" list to use the WSN list settings.
|