|
Maps can have latitude-longitude and/or x-y ticks labeled around the map edges.
To add ticks, select Options>Ticks on the menu bar at the top of the Map Module.
Lat-Lon tab
This section controls the display of LatLong ticks and labels. The "Show Lat-Lon Ticks" option enables LatLon ticks.
Compute Optimum Tick Interval From Map Scale - This option automatically calculates and posts LatLon ticks on the map.
Use The Following Tick Interval - This option specifies a particular lat-lon tick-labeling interval in degrees, minutes, and seconds. As an example, 0-30-0 would draw and label ticks at 30-minute intervals.
Label Direction
Internal Inward - This option draws the labels facing inward from the map.
Internal Outward - This option draws the labels outwards from the map.
Label Map Border - This option draws labels parallel around the edges of the map.
In Gutter - This option draws ticks in the gutter. Note that the gutter is set with the Map Margins and Preferences tool.
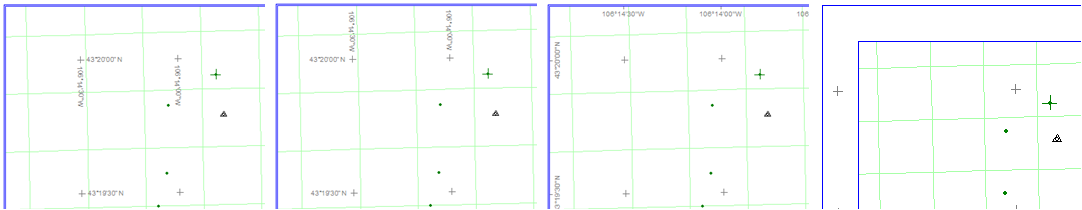
"Internal Inward" labels (left), "Internal Outward" labels (left center), "Label Map Border" (right center), "In Gutter" (right center)
Visibility
Show Lat-Lon Ticks - This option enables LatLon ticks on the Map Module.
Hide Lat-Lon Ticks - This option disables LatLon ticks on the Map Module.
No Internal Ticks - This option displays only the ticks inside the data limits.
Draw Lines - This option adds lines across the the LatLon Ticks.
X-Y tab
This section controls the display of XY ticks and labels.
Compute Optimum Tick Interval From Map Scale - This option automatically calculates and posts XY ticks on the map.
Use The Following Tick Interval - This option specifies a particular XY tick-labeling interval in degrees, minutes, and seconds. As an example, 0-30-0 would draw and label ticks at 30-minute intervals.
Plot Outer Ticks Only - This option suppress all XY ticks except the outer edge of the map.
Fill Border Corresponding to XY Values - This option adds adds a filled region between xy points. This option makes it a little easier to see the distances between XY ticks.
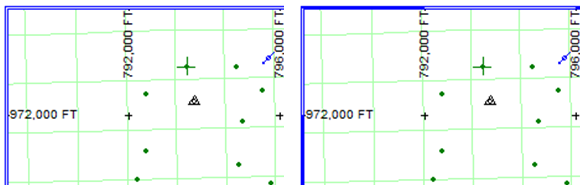
The "Fill Border Corresponding to XY Values" option disabled (left) and enabled (right)
Draw Lines Instead of Ticks - This option adds lines across the the LatLon Ticks.
Text Angle
Normal - This option draws the labels along the outer border of the map. These labels will be horizontal along the top and bottom of the map, and vertical on the left and right edges.
Rotated - This option draws the labels at right angles on the outer border of the map. These labels will be vertical along the top and bottom of the map, and horizontal on the left and right edges.
Visibility
Show XY Ticks - This option enables XY ticks on the Map Module.
Hide XY Ticks - This option disables XY ticks on the Map Module.
Sizes tab
This section controls the sizes of the tick labels and other attributes.
Lat-Lon Ticks - This option sets the size and style of the LatLon labels. Note that LatLons can be displayed in Degrees Minutes Seconds, Degrees Minutes, or in decimal degrees.
X-Y Ticks - This option sets the size and style of the XY labels. The "Label Every Nth" option decimates the XY ticks labels to only every Nth tick.
|