Map Monthly Production Chart Prod1/2 tab |
|
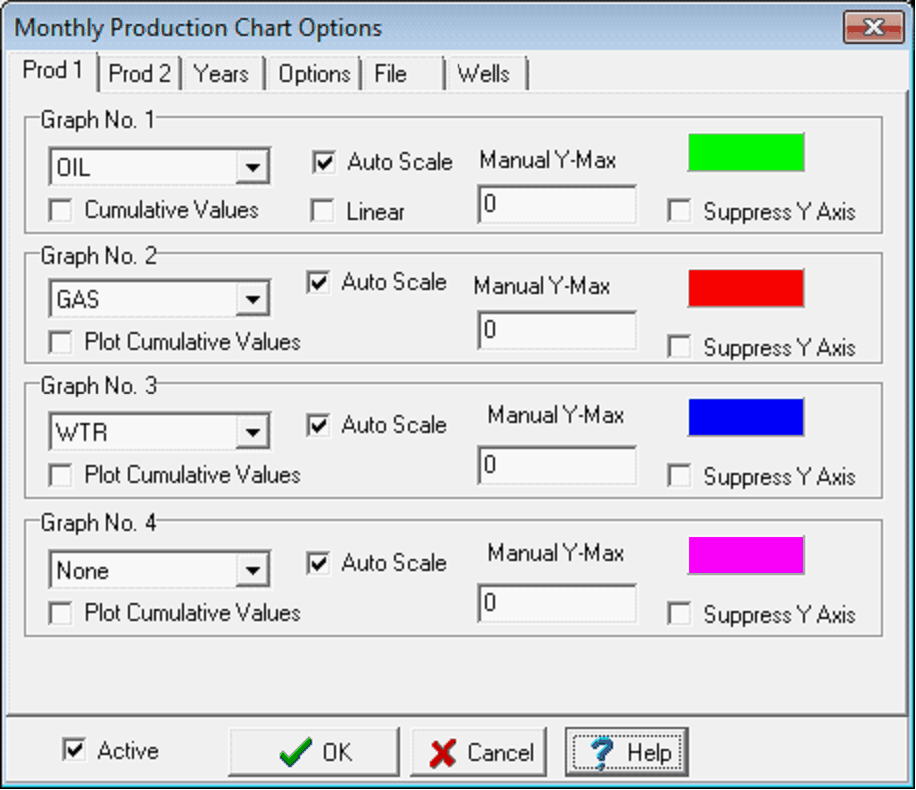
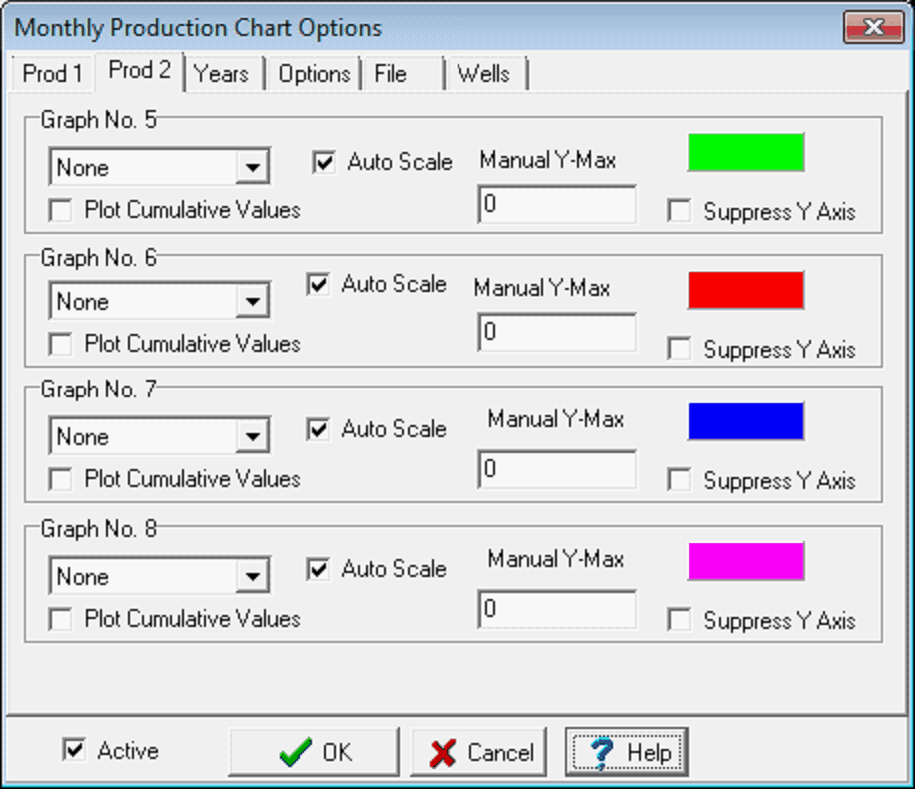
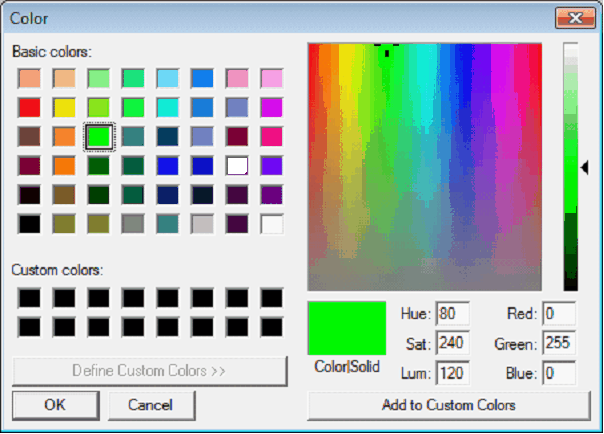
The Prod 1 and Prod 2 tabs set the production data shown on the production chart. Production Stream - This dropdown selects the individual production stream. By default, the OIL, GAS, and WATER and water streams are set in green, red, and blue. Select "None" to disable the graph. Cumulative Values - This option displays cumulative values for the selected stream at the bottom of the plot. Auto Scale - This option automatically scales the selected production stream to use the desired logarithmic decades set on the Options tab. Linear - By default, Petra plots production values on a logarithmic scale. This option forces Petra to instead use a linear scale. Manual Y-Max - This entry specifies a maximum for the selected production stream. Values above this plot will be off the top of the chart. Note that the minimum will be determined by the number of log cycles. Color Box - This bar sets the color of the stream on the plot. To change the color, select the color box, and select a new color on the
Changing the production stream color Suppress Y Axis - This option suppresses the labels on the Y axis. |


