Z Cross Plot Regression |
|
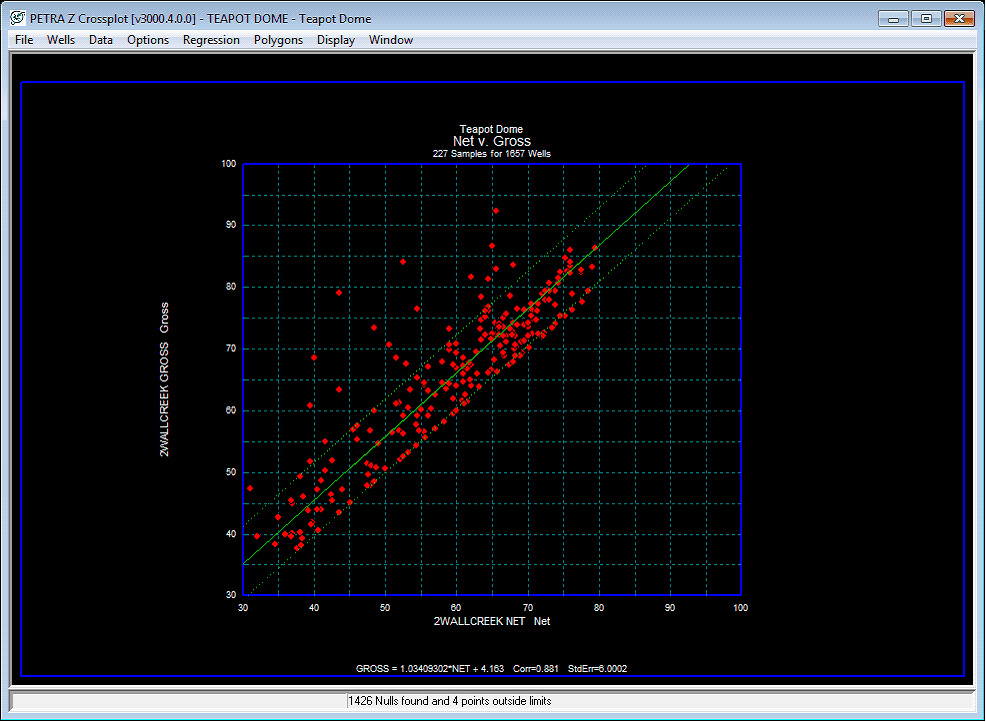
Petra can also perform variety of regression operations on the cross plot data. To add regression lines to the plot, select Options>Regression from the menu bar at the top of the screen.
The Cross Plot Module with a regression line
Auto Fit Line - This option adds a linear regression line to the log crossplot. The equation for the line, correlation, and standard deviation are all shown at the bottom of the screen. Auto Fit Quadratic - This option adds a quadratic curve to the log crossplot. Like the linear regression, the equation for the line, correlation, and standard deviation are all shown at the bottom of the screen. User Fit Line - The User Fit line creates a linear user-drawn line across the log crossplot. Simply draw the line across the data. The equation for the line, correlation, and standard deviation are all shown at the bottom of the screen. Show Standard Error Bars - This option adds error bars at one standard deviation. The better the line fits the data, the smaller these bars will be. As a reminder, these bars will include about 68% of the data points assuming a normal distribution.
|
