3D Visualization Module

Main module: Tools > 3D Visualization

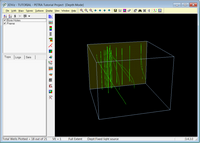
The 3D Visualization module (3DViz) is capable of displaying the following project data in a three dimensional objects in a cube (map X, map Y, and subsea depth):

  • Deviated and non deviated well bores
  • Formation Tops
  • Digital Logs
  • PETRA Grid Surfaces
  • Shows
  • Perfs
  • PETRA Overlay and Map images
  • PETRA Cross Section images

3DViz can only display sub sea depth data.  3DViz requires no special computer hardware and should run on most PC's.

Click to reduce image

To open the 3D Visualization module:
  • Main module: Tools > 3D Visualization
  • Click the  3D Visualization button clip0486on the Main module toolbar

Getting Started

Mouse actions

Task

Mouse Action

Rotate and move scene

Left click and drag

Zoom In

Right click and drag up

Zoom Out

Right click and drag down

Rotate Scene

Ctrl + Left click and drag

Pan Scene

Shift + Left click and drag, or Middle click and drag

Keyboard shortcuts

Task

Shortcut Key(s)

F2

Seismic Editing Mode

F5

Refresh Data From tables

F6

Restore Default View

Ctrl +

X Axis Options

Ctrl + E

Extent Options

Ctrl + F

Frame Options

Ctrl +

O Display Options

Ctrl + C

Clear All

Ctrl + Alt + C

Clear Screen

Ctrl + D

Display All

Ctrl + L

Set Light Position

Ctrl + W

Set Data Limits to Full Extent

+

Zoom In

-

Zoom Out

Z

Zoom Off

W -

Show as wire frame

S -

Show as solid