Grid Profile Option

 
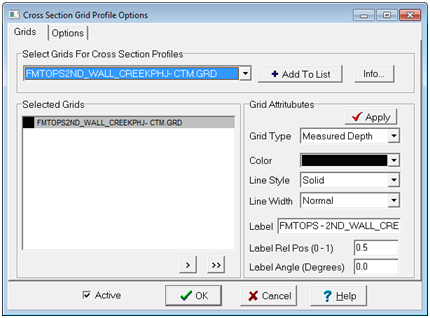
Cross Section: Tops > Contour Grid Profiles

The Cross-Section grid profile option projects grids created in the Map Module as a profile across structural cross sections. Grid profiles are not plotted on stratigraphic cross sections.

A maximum of 25 surfaces can be selected and displayed. Note that grids are identified as subsea structure, measured depth, or datum. Datum grids are not plotted, but are used to convert other grids to match the cross section depth axis scale. If your grids are not showing up on the cross section, check that you have the appropriate grid types set and are including a datum grid.

Grids tab

The Grids tab adds grids to the Cross Section Module, and controls their general appearance.
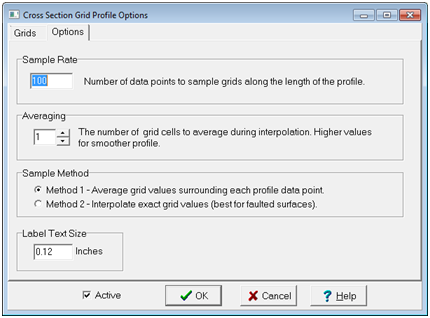
Select Grids For Cross-Section Profiles

Lists available grid files located in the project's GRIDS directory. The grid name will appear Selected Grids List when added.

Selected Grids

This section displays those grids which have been selected to plot on the cross section. Single clicking a grid name in this list will show the current attribute settings in the Grid Attribute section. Double clicking a grid name will show the grid's statistics. You may remove a single grid from the selection list by using the small '>' button located below the list box. To clear the selection list to start over, click the '>>' button.

Grid Attributes

Set each of the grid attributes for a selected grid. First, highlight the grid name in the "Selected Grids" list by clicking on the grid name.  Set the attributes (see below) and click the "Apply" button. (Note: the Apply button is optional).

  • Grid Type - The grid type determines how the grid depth values are interpreted. A grid must be identified as either "Subsea (Structure)", "Measured Depth", or "Datum". Including a datum grid, such as a contour map of the KB, will insure that the other grids are correctly drawn when switching between log depths and tvdss depths.
  • Color - Choose the line color for drawing the grid profile.
  • Line - Choose from one of the standard line pattern styles.
  • Line Width - Choose from one of the standard line thickness.
  • Label - Enter the descriptive title for the grid. The default comes from the grid file header.

Options tab

The option tab controls some of the details of drawing grid profiles.

Sample Rate

The sample rate determines how many samples are interpolated from the surface grid along the length of the cross section. The default value is 100.

Averaging

The averaging factor (N = 1..10) determines the distance around each profile data point in Method 1. Larger values result in smoother profiles. All grid node values within a distance of N times the grid spacing will be averaged using an inverse distance weighting function.  A value of 1 will sample only the grid nodes within a single grid cell distance. A value of 10 allows all grid nodes that are closer than 10 times the grid size to be included in the average.  For Method 2, the averaging factor determines the amount of smoothing applied by a triangular filter function.

Method

Choose one of the two grid sampling methods. Method 1 samples the grid using an inverse distance weighting and results in a smoothed profile.  Method 2 interpolates each profile point from the grid cell it is contained in.