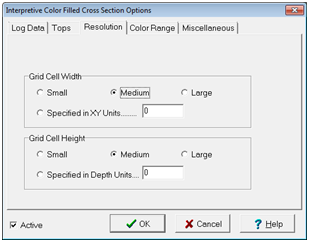
Interpretive Color Fill

t
Cross Section: Logs > Interpretive Color Fill > Set Interpretative Color Fill...

The Interpretive Log Color-Fill feature interpolates the values from a single log curve in between the wells.  This is useful for visualizing stratigraphic change across a field.  This tool uses selected formation tops to help guide and constrain the interpolation between one well and the next.

To open the Interpretive fill dialog:
  • Cross Section: Logs > Interpretive Color Fill > Set Interpretative Color Fill...
  • Click on the Cross Section tool bar

Log Data tab

Sets the log curve to be interpolated between wells.

Tops tab

Petra uses FmTops between wells to better constrain the interpolation. This tab is used to set boundaries for the interpretive log fill

Resolution tab

Controls the resolution of the interpretive color fill grid.

Generally, smaller grids look better but require more time to generate.

Color Range tab

Sets the Color bar for the interpretive log fill

Miscellaneous tab

Sets an additional option for optimizing the interpretive log fill.

The Log Data tab

Select Log Curve To Interpolate From Well to Well

Selects which log curve will be interpolated from well to well.

Use Log Aliases for Missing Logs

Allows the interpretive log fill to use log aliases.  Without this option, only the wells with the exact curve name will have a log fill.

User Curves from Other Well Completions

Allows the interpretive log fill to use log curves from other completions.

Tops tab

Fill Between the Selected Tops - Lists the tops currently displayed on the Cross Section Module. You can choose the tops used in the interpolation. Color-fill will be generated between each pair of tops chosen. For example, if you have tops A, B, C and D and do not choose C, then you will have color-fill from A down to D. The grid will follow the A-B interval and the B-D interval. Top C will have no influence on the grid. If you chose only A and B then the color-fill when only be generated between tops A and B.

Resolution tab

The Resolution tab controls the resolution of the interpretive color fill grid.  Generally, smaller grids look better but require more time to generate.

Grid Cell Width

This option sets the width of each grid cell, and can be set to small, medium, large, or to a specified XY map unit width.  In general, the default width is sufficient for most cross sections.  

Grid Cell Height

The vertical resolution sets the height of each grid cell, and can be set to small, medium, large, or to a specified depth unit.  

This usually should be set to the resolution of the curve data on the cross section, as coarse grid heights can obscure thinner beds..  As an example, curve data with a half foot resolution should have a grid cell height of 0.5.  

Color Range tab

This tab sets the Color bar for the interpretive log fill.

Minimum

Sets the lower value for the color bar.

Maximum

Sets the upper value for the color bar.

Interval - This entry sets the interpolation interval for the color bar.  Note that the Color bar can have a maximum of 46 intervals, starting with the minimum and counting up towards the maximum.

Set Colors...

Opens the Color Interval Definition, which can more directly change the intervals and specific colors on the interpretive log fill.

Miscellaneous tab

This Miscellaneous tab sets an additional option for optimizing the interpretive log fill.

Faster Display - Larger Plot Files

Stores the interpretive color fill grid in RAM, which can accelerate cross section plotting at the expense of using system resources.

Slower Display - Smaller Plot Files

Does not store the interpretive color fill grid in RAM.  This decreases the consumption of system resources, but can result in slower plot times and poorer graphics.

Interpretive Color Fill and the Top Connection Method

The Interpretive Color Fill's appearance is controlled by the Top Connection Method Dropdown Method on the Formation Tops' General tab.  

XSect_grid1 XSect_grid2

The "Connect Tops to Borehole" (Top) and Connect Tops to Track Boundaries (Bottom)