Cross Section: Wells>Plot Interval Data.
Plotting Interval Data in the Cross Section Module
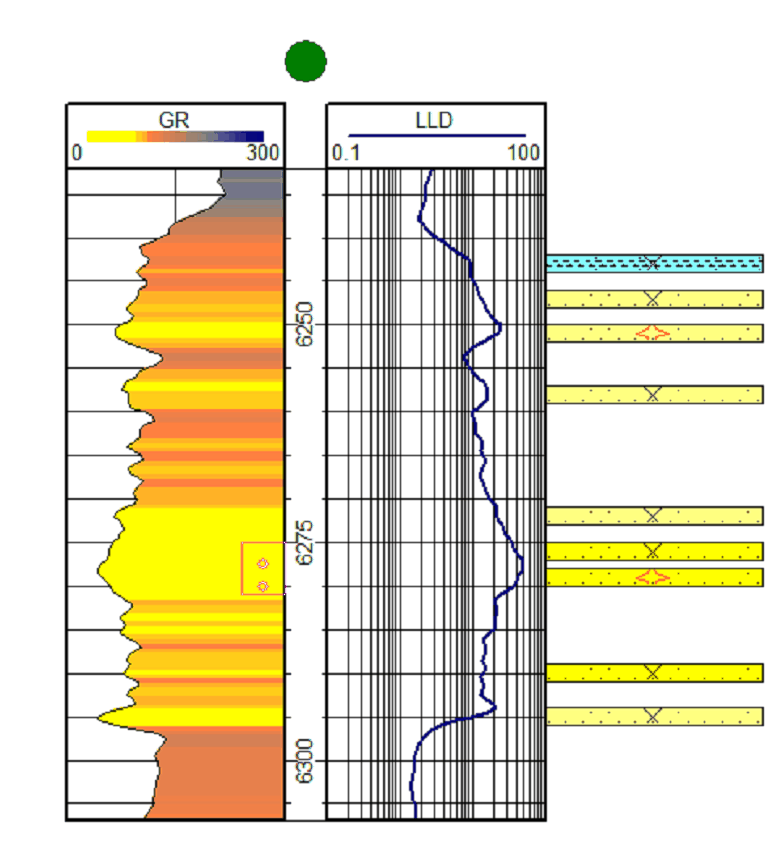
The Cross Section Module can display any combination of interval data colors, patterns, markers and text.

The Plot Interval Data.dialog lists interval data tables along with a series of tabs that control how interval data (Style, Text, Filters) are displayed.
Style tab
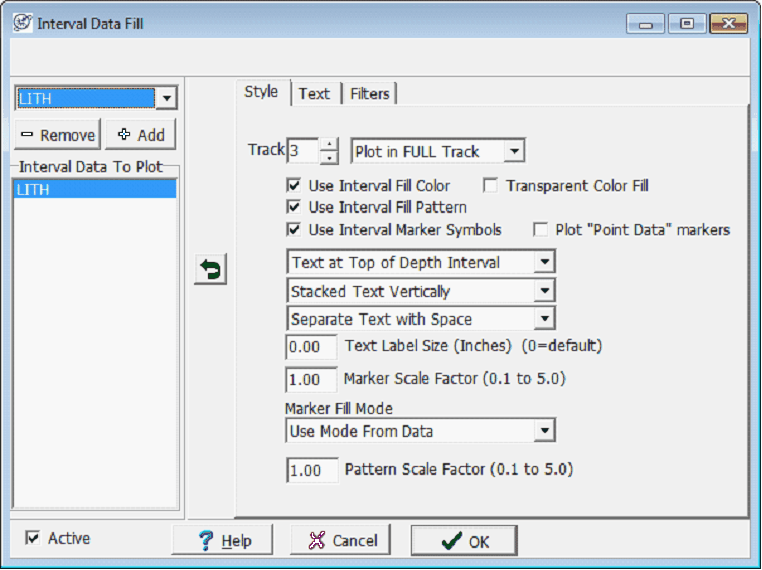
The Style tab governs how the interval data is displayed on the Cross Section.

|
Use Interval Fill Color
|
Fills interval with the interval's color.
|
|
Use Interval Fill Pattern
|
Fills interval with the interval's pattern.
|
|
Use Interval Marker Symbols
|
Fills the interval with the interval's marker symbols. The Marker Scale factor below changes the size of these symbols. The individual intervals marker fill can also be overridden with the Marker Fill Mode below.
|
|
Text Positioning
|
Text can be positioned at the top, middle, or bottom of an interval. Select the drop down by default labeled Text At Top of Depth Interval to change where text is plotted.
|
|
Combining Text Horizontally or Vertically
|
This changes how multiple text fields are displayed. Combine Text Horizontally lists additional text fields to the right of the first text box. Combine Text Vertically stacks additional text fields on the bottom of the first text field.
|
|
Separate Text with Space
|
This option changes how different fields are separated when plotted horizontally. Horizontally combined text boxes can either be separated with a space, slash, a dash, or a comma.
|
|
Text Label Size
|
This option sets the size of text (in inches). Keeping this option at 0 is a good default. Remember that an absolute text size probably won't be appropriate for both computer screens and large paper plots; 1 inch letters will look huge on a computer screen, but will be normally sized on a large wall plot.
|
|
Marker Scale Factor
|
Sets the scale of the interval markers. Setting the scale factor to 0.5, for example, plots all markers at ½ their original size.
|
|
Marker Fill Mode
|
Though every interval stores information on how to display markers, this option overrides the fill mode for all displayed markers on the cross section. Note that this does not change the settings stored in the interval.
|
|
Pattern Scale Factor
|
This option sets the pattern scale, or density, of the lithologic pattern fill. Higher numbers here generate higher pattern density.
|
Text tab
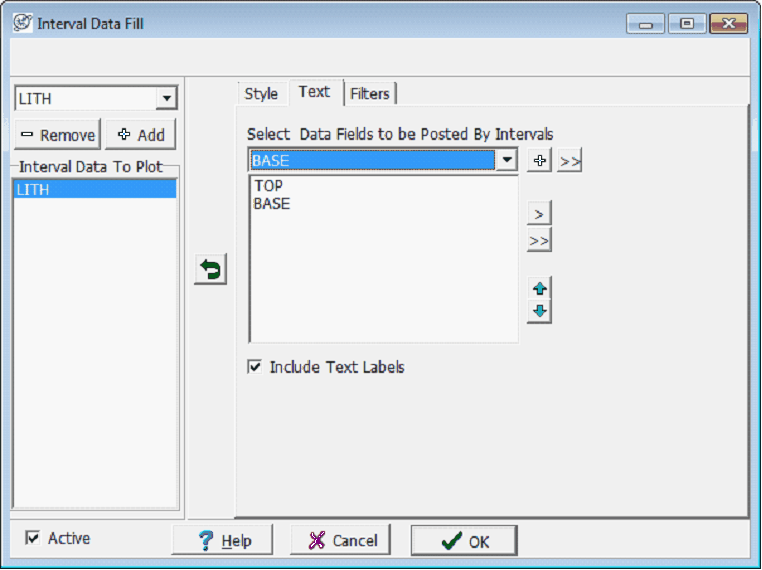
The Text tab sets the specific data fields to be displayed as text.

To add text, select the appropriate table on the Interval Data to Plot dropdown menu and a data field from the Data Fields to be Posted By Intervals dropdown menu on the right. Select the  button to adds the field to the list. Items at the top of the list will be at the top (for vertically combined text) or on the left (for horizontally combined text). Seecting the Include Text Labels option adds the field name as a prefix before each data field. Particularly elaborate displays can also be saved as a template in a *.IDF file with the Save/Load Template buttons. button to adds the field to the list. Items at the top of the list will be at the top (for vertically combined text) or on the left (for horizontally combined text). Seecting the Include Text Labels option adds the field name as a prefix before each data field. Particularly elaborate displays can also be saved as a template in a *.IDF file with the Save/Load Template buttons.
Filters tab
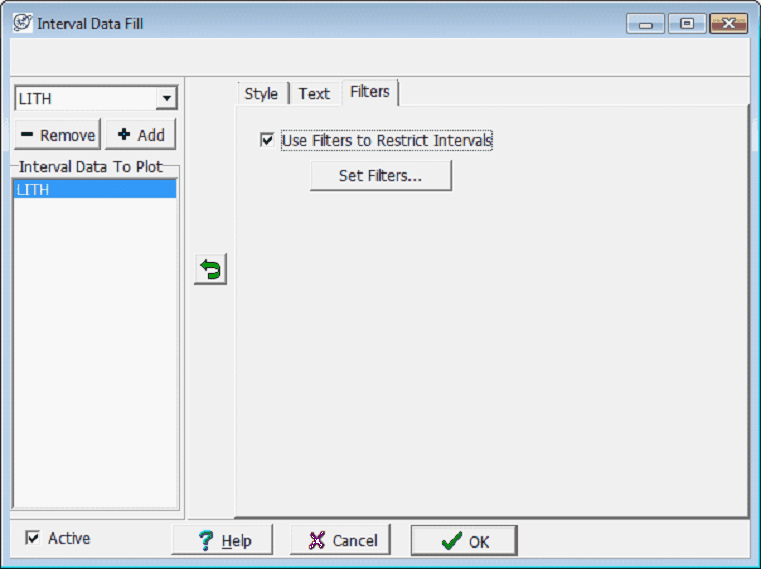
Filters provide more control over which intervals are displayed on the Cross Section Module. Intervals that do not meet the filter criteria are not displayed. To create or modify a set of filters, select the Set Filters
button on the Filters tab. For more information on filters see Using Interval Filters.

|