Histogram data definition |
|
The Histogram Data Definition tool sets the basics of the log histogram, including the log curve used, the limits and shape of the histogram, and the depth interval. Log Curve tabThe Log Curve tab sets the histogram title, curve, and axis.
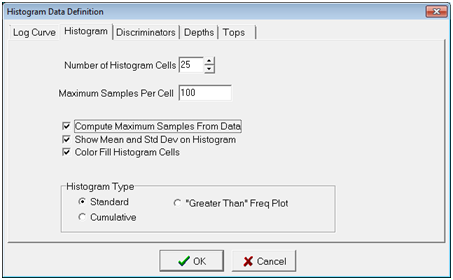
Histogram tab
Histogram Type
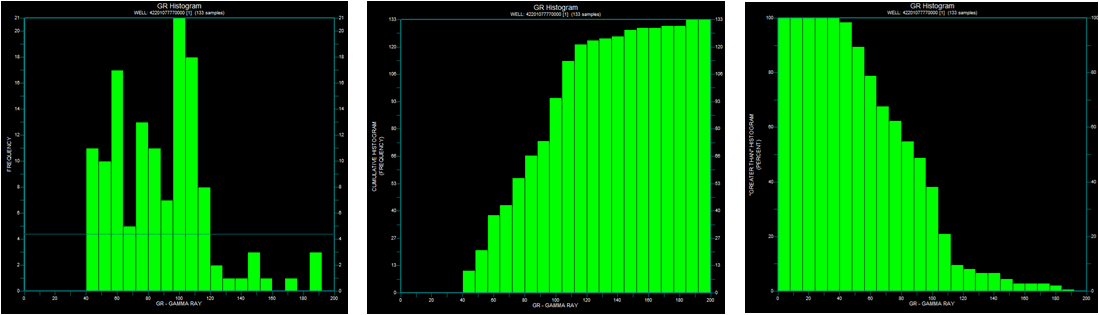
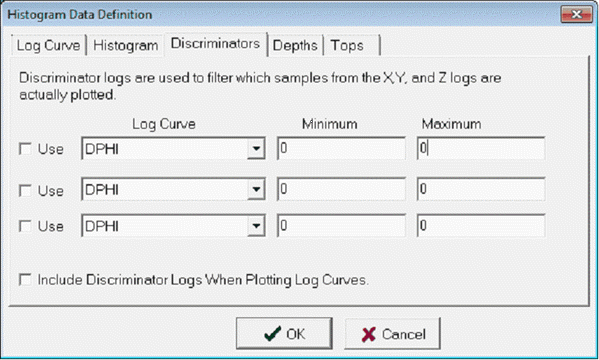
Standard (Left), Cumulative (Center), and "Greater Than" Freq Plot (Right) Histograms Discriminators tabThis tab establishes a discriminator curve to filter the sampled log curve. At depths where the discriminator curves are outside the minimum and maximum values, the corresponding depth will be left out of the histogram. If this box is checked and the log is absent, the statistics will not be calculated.
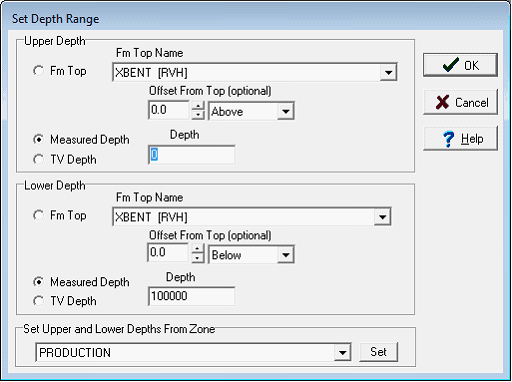
Depths tabBy default, Petra tries to display data over the entire log curve. Especially for log normalization, it's much better to keep the curve histogram limited only to the most relevant section.
To set depths by a zones interval definition, select the desired zone on the Set Upper and Lower Depths From Zone dropdown menu. Sample Decimation - This option decimates the data to only keep every Nth sample in the histogram. Setting this value to 2, for instance, would only display every other sample. Setting this value to 5 would only load every 5th sample. By default, this option is set at 1 to include every sample in the histogram. Tops tabThe Tops tab draws formation tops on the log curve on the right part of the Histogram Module. Tops can be particularly useful for orienting yourself to the log curve.
Display Tops on Logs - This option enables and disables formation tops on the log curve. Deselecting this option will keep the selected formation tops. To select the tops that appear on the log curve, add tops to the "Selected Zone Items" list by selecting th e">" button to add a selected top, or the ">>" button to add all tops. To drop a top from the "Selected Zone Items" list, select the desired top and select the "<" button. To drop all tops from the "Selected Zone Items" list, select the "<<" button. |