Log Crossplot Data Discriminators tab |
|
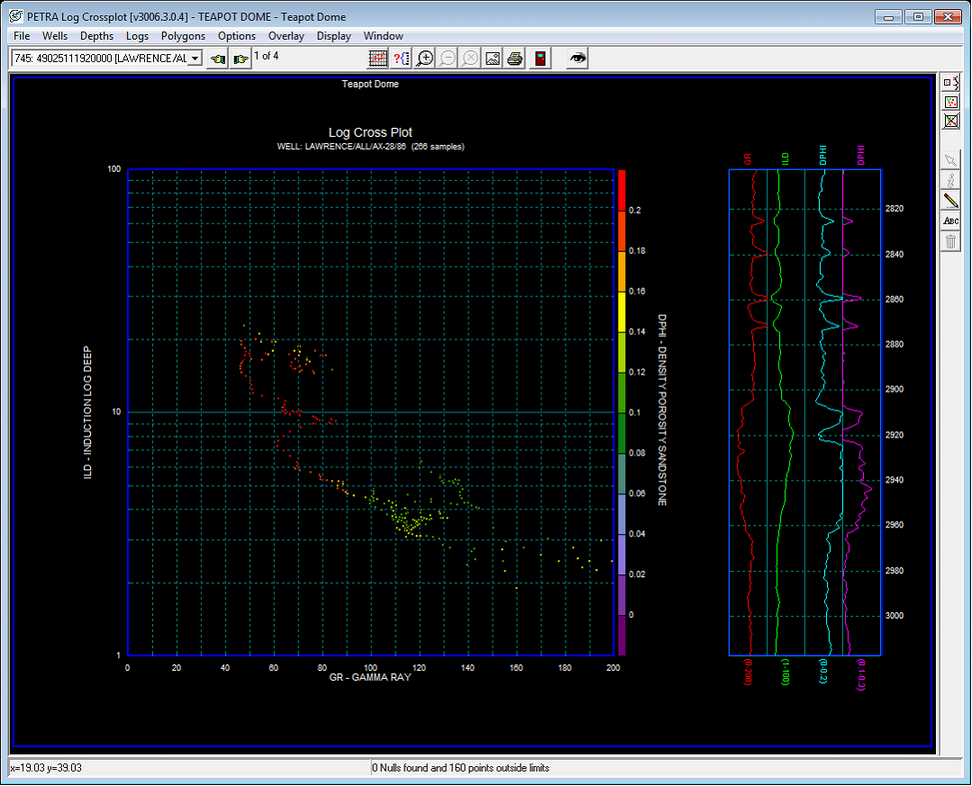
The discriminator curve filters data points by log criteria. Select one or more curves on the dropdowns, and set the scale using the Minimum and Maximum. Data points that fall outside of this data criteria are not included on the cross plot. In the example below, only data points where density porosity is between 10% and 30% will be included on the plot.
Include Discriminator Logs When Plotting CurvesThis option simply plots the discriminator curve along the other curves on the right side of the screen and at the scale specified by the minimum and maximum cutoff values. In the example below, low density porosity values are filtered out, simplifying the plot. Notice that the density porosity curve (DPHI) is used twice as a Z Axis color scale, and also as a discriminator curve.
|