Log Crossplot Data X-Y Axes tab |
|
The X-Y tab is only available when X-Y and X-Y-Z Plot is selected on the General tab. This tab sets the curves and scales for the scatter cross plot. Note that if any of the curves are unavailable, Petra cannot plot the diagram. If using log aliasing, make sure to select Use Log Aliases on the bottom part of the tab.
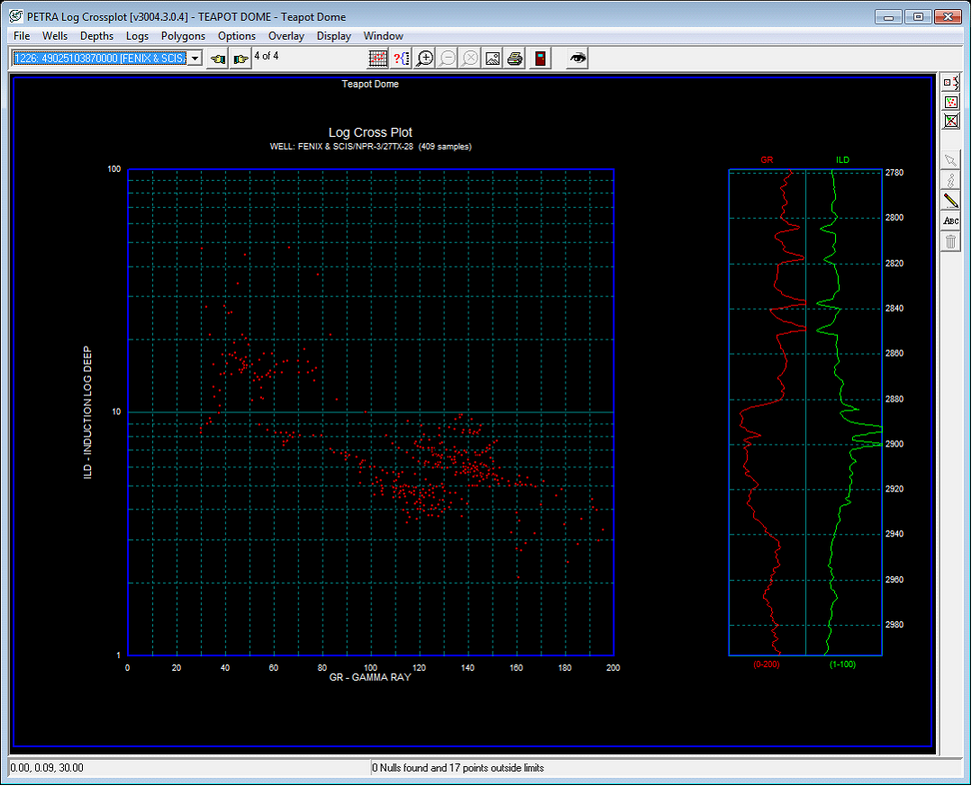
X-Axis and Y-AxisThis section sets the curve and scale for the horizontal X axis and the vertical Y axis. Select the desired curve on the dropdown, and set the scale using the Minimum and Maximum. In the example below, the X axis is a gamma ray log, and the Y axis is a deep resistivity log. Note that both curves can also be displayed in a logarithmic scale; just be sure to select a minimum above zero. The Use Depths of Above Curve for X/Y Axis will instead plot the other axis curve relative to depth. The example below shows an X Y log cross plot where gamma ray is on the horizontal X axis and deep resistivity is on the vertical Y axis. Note that the resistivity log is on a log10 scale. The logs for the relevant curves are plotted to the right of the screen since this plot only shows the log cross plot for a single well.
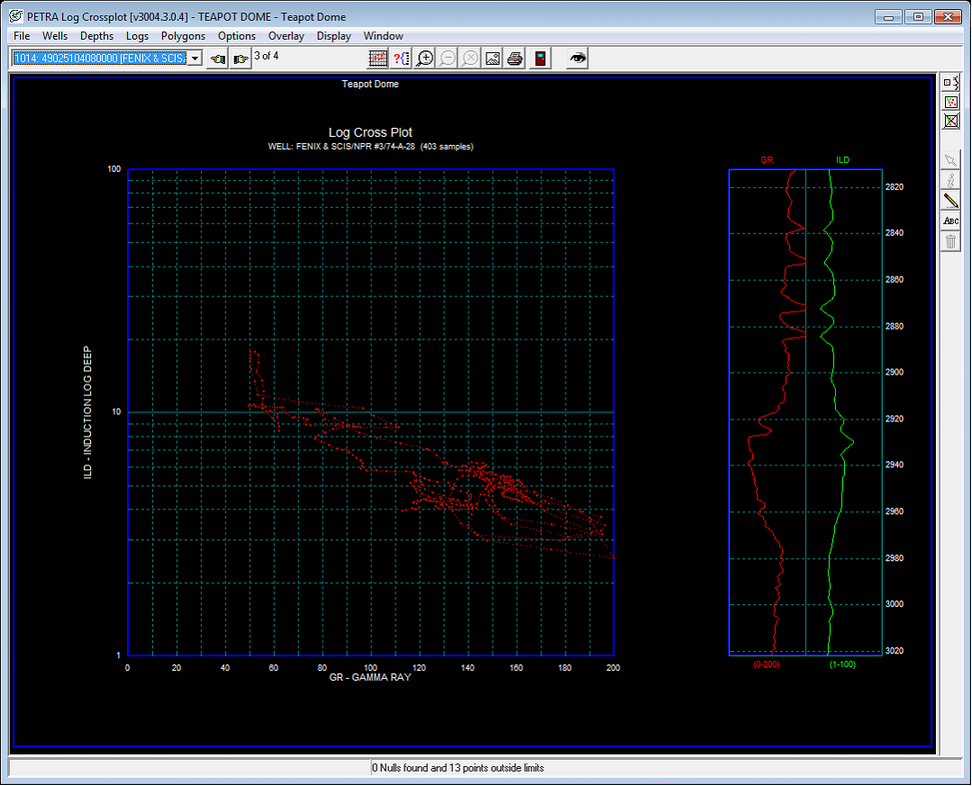
Swap X & Y - This button simply swaps the selected curves, scales, and settings for the X and Y sections. Connect Points - This option draws a connecting line between data points down MD on the curve. This connecting line is a little smaller than the data points, and is red by default. The example below shows the cross plot with connected points. Especially with less log footage (and fewer data points), this plot illustrates how the curve cross plot relationship changes with depth.
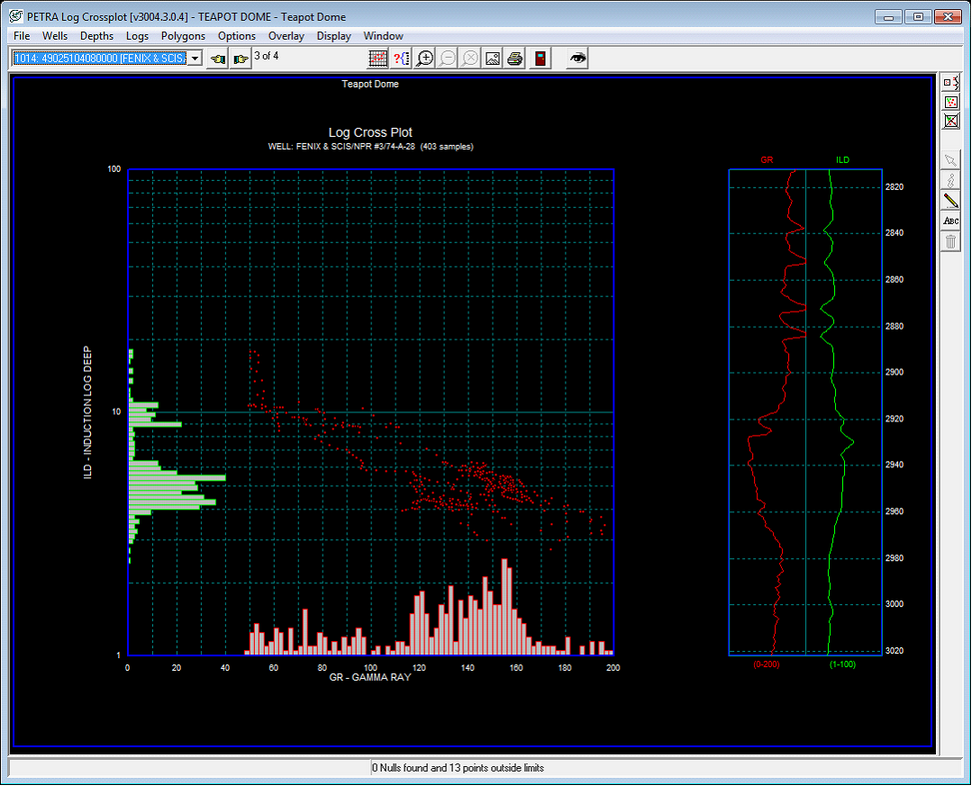
Plot Histograms - This option adds a histogram along both axes showing the distribution of each curves data points. The example below shows histograms arranged for both the horizontal and vertical axes.
|