Decline Curve Forecasting |
|
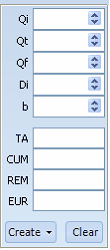
The Forecast Parameters and Results box provides model parameters and forecast results. The Up and Down arrows on the right of each entry modify the input parameters by an incremental amount. Note that the plot is updated in real-time. Clicking LMB on the Up arrow increases the value and clicking the Down arrow decreases the value. Values can be entered by holding the LMB down and highlightingswiping the field. A new value can be entered and the forecast model adjusted accordingly. The Forecast Parameters and Results box may be moved to the graph area by going to the top of the box. Hold down the LMB when the crosshairs are displayed and drag to the graph area.
Model parametersQi, Qt, Qf, Di and b may be modified by either entering values or incrementally changed by clicking the Up / Down arrows in each field. Rotation about QtRotation of the exponential fit can be accomplished by holding the LMB down on the box representing Qi and rotating the line. Values in the forecast box will change accordingly.
Parallel move of forecast lineA parallel move of the forecast line (Di constant) is accomplished by holding the LMB down on the box on the center of the forecast line. Values in the forecast box will change accordingly.
|


