|
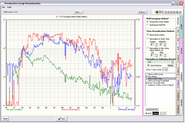
The Production Group Normalization Tool displays and analyzes monthly production data for a set of wells. With this tool, production data can be easily summed together, averaged, or time-normalized back to a single starting date. This is useful for comparing historical and average production between different populations of wells. For example, this tool can be used to compare production differences based on completion techniques, reservoir properties, or structural setting.
Important:This tool only works with wells that have monthly production data. Wells missing monthly production data will not contribute to cumulative or average plots. Production streams where each well in a lease contains a fractional percentage of the total lease production can also generate unreliable results.
Settings can be saved as a Production Group Plot file (*.PGP) in the projects PARMS folder for re-use. The Production Group Normalization Tool still reads and recalculates from Petra's database, so data shown on the screen after loading a plot will reflect the most current production stream information in the database.

To open the Production Group Normalization Tool:
Main module: Tools>Production Group Plot
There are three ways to select which wells will be included in the calculation:
- From the Map module, Map module: Wells>Select Wells. Here a set of geographically contiguous wells with Inside Rectangle, Inside Polygon, or Outside Polygon can be selected. You can also select wells individually with the With Mouse command. Click to select individual wells with the left mouse button, and right click to stop.
- From the Production Group Normalization dialog:
·Wells>Load WSN File
·Wells>Select Wells...
Once wells are selected in the group production tool, it's also possible to individually turn wells on and off from the WELLS tab. Turning a well off removes its contribution to the aggregate cumulative or average production.
Production Group Normalization tabs
Wells
Options
Oil, Gas, Water and Other(1-5)
Ratios
Comments
Report
|