X & Y Axis |
|
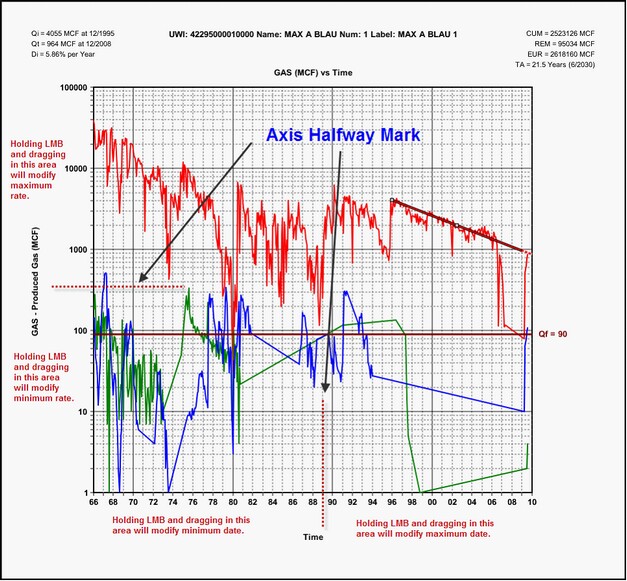
The Y (Production Rate) and X (Time in Years) axes can be adjusted graphically by holding down the LMB and dragging in the clear area next to the axis of interest. Note the dotted lines which denote the axis halfway marks on each axis. Holding down the LMB and dragging in the appropriate area will modify either the minimum or maximum value. Fit Chart to Data ExtentsThe Fit Chart to Data Extents expands the production history to full graph extents.
|