Z Cross Plot Data Definition X-Y Axis |
|
The X-Y tab ontrols the basic settings for the plot, like the plot title and axes.
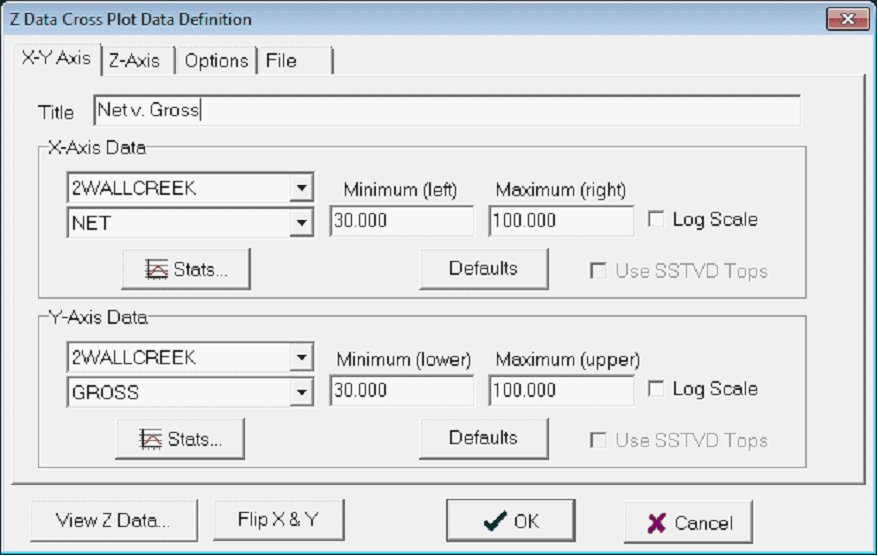
The Z Data Cross Plot Data Definition X-Y Axis tab
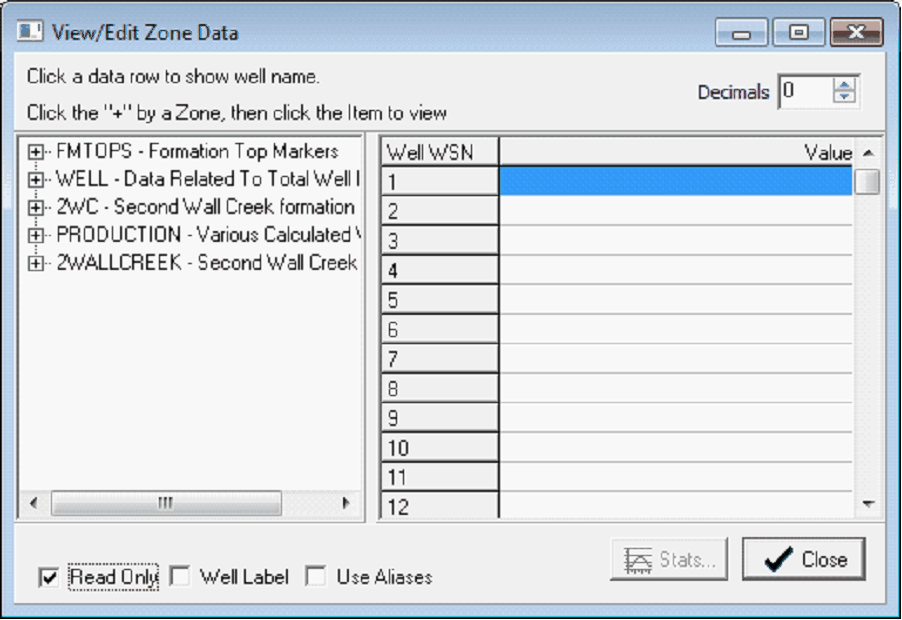
Title - This entry sets the title of the plot. X Axis DataThis section sets the specific zone and data item, for the X axis of the plot. The upper dropdown select the zone, and the lower dropdown selects the data item. Minimum (left) - This entry sets the minimum value for the cross plot. Maximum (right) - This entry sets the maximum value for the cross plot. Log Scale - This button sets the selected axis to a logarithmic scale. Stats - This button displays a histogram of the z data for the selected wells, which can aid in setting a reasonable minimum and maximum scale for the plot. Defaults - This option sets the minimum and maximum scale based on the minimum and maximum data value in the data. If the minimum and maximum values are more than 500 apart (and is not a top or contains negative numbers), Petra will automatically scale the axis to a logarithmic scale. Note that dates can also be used in these fields in the format MM/DD/YY, like 01/01/1910. Y Axis DataThis section sets the specific zone and data item, for the Y axis of the plot. The upper dropdown select the zone, and the lower dropdown selects the data item. Minimum (lower) - This entry sets the minimum value for the cross plot. Maximum (upper) - This entry sets the maximum value for the cross plot. Log Scale - This button sets the selected axis to a logarithmic scale. Stats - This button displays a histogram of the z data for the selected wells, which can aid in setting a reasonable minimum and maximum scale for the plot. Defaults - This option sets the minimum and maximum scale based on the minimum and maximum data value in the data. If the minimum and maximum values are more than 500 apart (and is not a top or contains negative numbers), Petra will automatically scale the axis to a logarithmic scale. Note that dates can also be used in these fields in the format MM/DD/YY, like 01/01/1910. MiscView Z Data - This button opens a zone data item viewer. Here, use the "+" button to the left of the desired zone to expand the tree, and then select the desired data item. Note that entries here can be edited as well.
The View/Edit Zone Data tool with no data item selected (left) and with a data item selected (right) Flip X Y - This option flips the X and Y axis. |


