|
The Profile View's Correlate tool correlates specific markers and formation tops between horizontal and vertical wells. Note that this tool only works on digital logs - raster logs will need to be digitized.
To open the correlation window, select Logs>Correlate on the menu bar at the top of the Profile View, or select F2.
Getting Ready
Some things must be setup in the Profile View before using this tool:
- Add two or more wells to the profile view
- Select an 'Active' Well (by right clicking on well symbol). This is normally your horizontal well.
- Select an 'Offset' Well (by right clicking on well symbol). This may be a pilot hole or any other well in the region.
- Setup the Digital Logs for these wells through the "Logs and Tracks" Dialog. (This is somewhat optional as these can be changed within the correlation tool, but it is easier if it matches what is in the profile view)
Correlation Tool
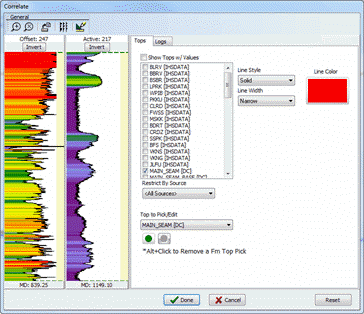
Here is an example of the Correlate Windows with Gamma Ray curves of both a vertical and horizontal Well when first opened. You will notice that the track on the left is for the 'Offset' Well and the right track contains the 'Active' Well. Before launching I had setup the GR curves with geocolumn shading for these two wells and all of those attributes were pulled into this window. You can also click on the Logs tool button  to add, remove, and modify attributes of the displayed Logs. At the bottom of each track there is a depth indicator. This shows you the MD your cursor is within each track/log. Also, there are two tabs on the right side, Tops and Logs. The options in these are similar to similar options in other parts of Petra. The different parts of this window are explained in detail below. to add, remove, and modify attributes of the displayed Logs. At the bottom of each track there is a depth indicator. This shows you the MD your cursor is within each track/log. Also, there are two tabs on the right side, Tops and Logs. The options in these are similar to similar options in other parts of Petra. The different parts of this window are explained in detail below.

Manipulating the Logs
Zooming  
You can "zoom" in on certain depths within a well by clicking the Zoom button and then left click a depth (on either well), and while holding the mouse button down, drag to another depth and release. If you want to see the entire log(s), click the Zoom Off button and then single click the desired well.
Invert 
To invert a well, simply click the Invert button on that well.
Stretch/Squeeze
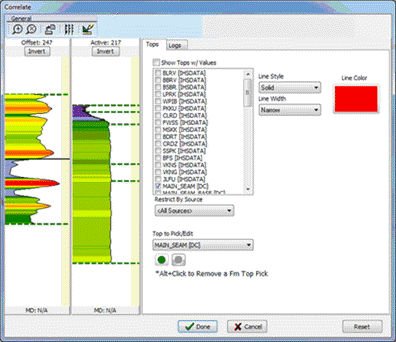
In order to correlate a horizontal well to a vertical, there is the need to manipulate the log by stretching and squeezing it. This is easily done in this window. When you first enter this dialog, there will be two green dashed lines (top and bottom) of each well. We will call these scaling points. You can simply left click and drag any of these around and watch the log react. To add additional points, just double click at the desired location. Here are some shortcut keys to help with this process along with a screen shot demonstrating this functionality.
|
Scale Section of Log (stretch/squeeze)
|
Ctrl + Left Click + Drag Up/Down
|
|
Slide Log Up/Down
|
Shift + Left Click + Drag Up/Down
|
|
'Slip' Log Within Region
|
Middle Click + Drag Up/Down
|
|
Add Scaling Point to Log
|
Double Left Click
|
|
Delete Scaling Point
|
Alt + Left Click
|

Formation Tops
To display/hide certain tops, just check/uncheck it in the Tops tab. The Line Style/Width and Color options apply to whatever top you have selected (if it is checked).
Picking Tops

To enter Top Picking Mode, simply select a displayed top from the drop down (shown above) and hit the green button. You can now left click on either well to add a top pick at that depth pick or alt + left click an existing pick to remove one. When done picking, simply hit the red button (next to green button).
Top picks done in the Correlate Window are always MD/TVD Linked Tops. Also, you can still access all functionality within the profile view while the Correlate Window is open. If you choose to still pick tops in the profile view you can do so and use the Correlate Window to help as a reference.
Calculate Apparent Dip 
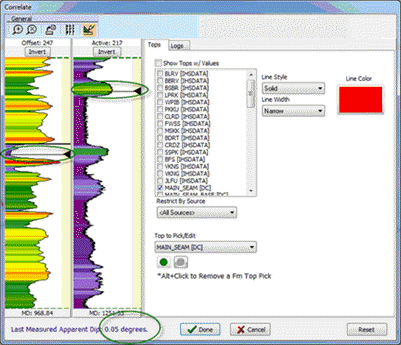
Clicking this button enables a mode where one can calculate the apparent dip between any points on the two wells. Once in this mode, simply click (or click and drag) a point on each well; and the apparent dip will be calculated and displayed below the tracks. This calculation uses the well locations, datums, and the directional survey data (if available) and finds the XYZ location in 3d space between the two points. Then the apparent dip is calculated from horizontal.
This Apparent Dip is always shown as positive.

Reset to Default 
Clicking this button defaults all Top and Log settings to match what is being displayed in the Profile View.
|
 to add, remove, and modify attributes of the displayed Logs. At the bottom of each track there is a depth indicator. This shows you the MD your cursor is within each track/log. Also, there are two tabs on the right side, Tops and Logs. The options in these are similar to similar options in other parts of Petra. The different parts of this window are explained in detail below.


